Advertisement

Jangan lupa olahraga biar nggak baper (ˇ▼ˇ)

Sabtu, 27 Februari 2016

My homage to the Atlas of the Census

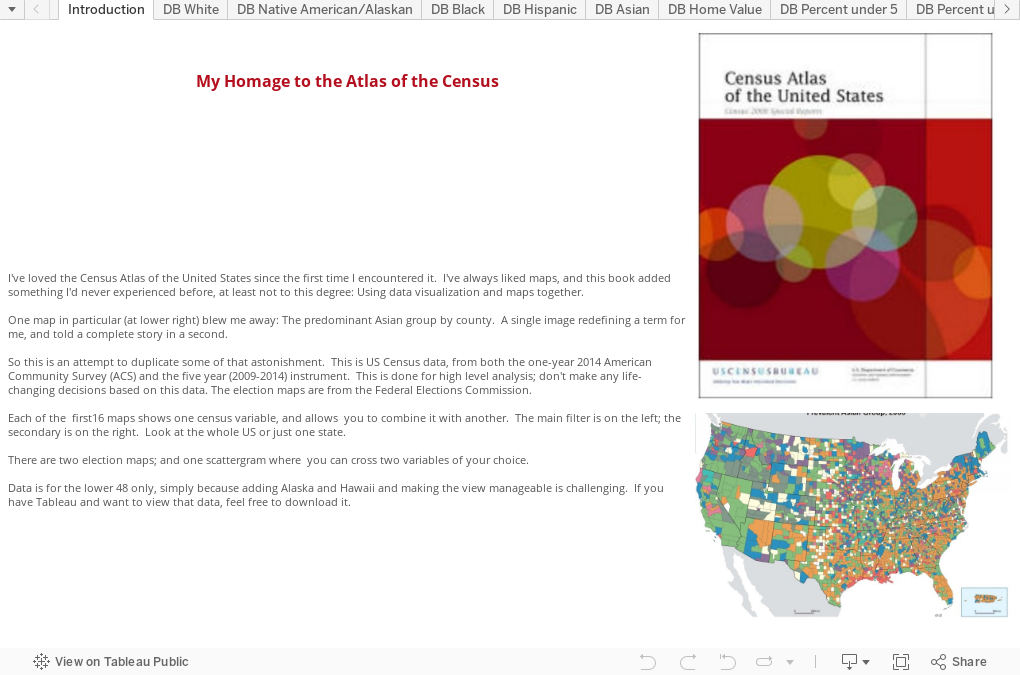
In eighth grade, a teacher introduced my class to the Statistical Abstract of the United States, and it changed the way I looked at numbers and information.  Of course, in those days, it was just a book, and very hard to interact with.  But I still remember poring over it, absorbing interesting, if arcane, facts about the country and its regions.  Ever since, I've been fascinated with reference books like it.

Then, sometime about 2005, I came across the Census Atlas of the United States, and my mind was blown even more.  It contains page after page of maps, representing gobs of data, visualized in a way that tells stories, sometimes with a single picture.  One map, especially, made an impression on me. It's in this chapter, page 14 of the chapter, page 40 of the book, showing Prevalent Asian Group, by county.  If you can't download that large .pdf file, it's below:
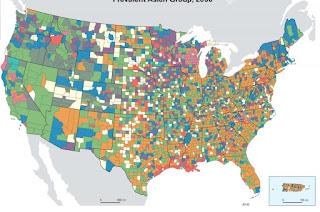

In my job, and in higher education in general, we think about race and ethnicity a lot, of course, but here was something that exploded and challenged the status quo and made me think differently: "Asian," was not a monolithic term.  Far from it.

That day, I bought a copy of the Atlas, and always pick it up when I see it.  It's astonishing, I think, and I still discover something new every time I spend some time with it.

I've wanted to do my own mini-version for a long time, but the thing that makes it hard is getting at Census Bureau data.  It's either very hard to extract, or rolled up in ways that don't inspire further analysis.  But I did come across a file that was accessible and fairly easy to work with, with data on a lot of factors at the US county level.  And I started working on it.

This includes 19 maps: The first 16 show US counties, colored by the variable indicated.  In the heading is the US average.  For instance, about 66.2% of the US population is "White alone."  All maps are color coded with that center value as the center point.  Check the legend.

You can look at the whole US or just a state; unfortunately, adding Alaska and Hawaii makes it hard and time consuming to get the maps to look good.  If you have Tableau, you can download this and look at it yourself.

The maps have data filters on them too.  So if  you're looking at the view with percent of adults with a high school diploma, for instance, you can pull the slider up or down to show only those counties with very high or very low values.  On each map, I've also added a somewhat-random second slider, so you can see combinations of variables.  On the high school graduates one, for instance, you can also look at population density.  See which counties have high/high, high/low, or low/low combinations. Play around.

Additionally, there are three other views: Two showing 2012 presidential election results, and one scatter-gram, where you can cross any two variables, and see the relationships between them.

If you work in my job, you might find interesting data that can help you understand how--and why--your distant markets are different than your local ones.  Or maybe it's just fun to play with.

Either way, I hope you enjoy it.  I'd love to hear what you discover.


- Hallo sahabat The secret, Pada Artikel yang anda baca kali ini dengan judul , kami telah mempersiapkan artikel ini dengan baik untuk anda baca dan ambil informasi didalamnya. mudah-mudahan isi postingan yang kami tulis ini dapat anda pahami. baiklah, selamat membaca.

Judul : My homage to the Atlas of the Census
link : My homage to the Atlas of the Census

Baca juga


In eighth grade, a teacher introduced my class to the Statistical Abstract of the United States, and it changed the way I looked at numbers and information.  Of course, in those days, it was just a book, and very hard to interact with.  But I still remember poring over it, absorbing interesting, if arcane, facts about the country and its regions.  Ever since, I've been fascinated with reference books like it.

Then, sometime about 2005, I came across the Census Atlas of the United States, and my mind was blown even more.  It contains page after page of maps, representing gobs of data, visualized in a way that tells stories, sometimes with a single picture.  One map, especially, made an impression on me. It's in this chapter, page 14 of the chapter, page 40 of the book, showing Prevalent Asian Group, by county.  If you can't download that large .pdf file, it's below:


In my job, and in higher education in general, we think about race and ethnicity a lot, of course, but here was something that exploded and challenged the status quo and made me think differently: "Asian," was not a monolithic term.  Far from it.

That day, I bought a copy of the Atlas, and always pick it up when I see it.  It's astonishing, I think, and I still discover something new every time I spend some time with it.

I've wanted to do my own mini-version for a long time, but the thing that makes it hard is getting at Census Bureau data.  It's either very hard to extract, or rolled up in ways that don't inspire further analysis.  But I did come across a file that was accessible and fairly easy to work with, with data on a lot of factors at the US county level.  And I started working on it.

This includes 19 maps: The first 16 show US counties, colored by the variable indicated.  In the heading is the US average.  For instance, about 66.2% of the US population is "White alone."  All maps are color coded with that center value as the center point.  Check the legend.

You can look at the whole US or just a state; unfortunately, adding Alaska and Hawaii makes it hard and time consuming to get the maps to look good.  If you have Tableau, you can download this and look at it yourself.

The maps have data filters on them too.  So if  you're looking at the view with percent of adults with a high school diploma, for instance, you can pull the slider up or down to show only those counties with very high or very low values.  On each map, I've also added a somewhat-random second slider, so you can see combinations of variables.  On the high school graduates one, for instance, you can also look at population density.  See which counties have high/high, high/low, or low/low combinations. Play around.

Additionally, there are three other views: Two showing 2012 presidential election results, and one scatter-gram, where you can cross any two variables, and see the relationships between them.

If you work in my job, you might find interesting data that can help you understand how--and why--your distant markets are different than your local ones.  Or maybe it's just fun to play with.

Either way, I hope you enjoy it.  I'd love to hear what you discover.


Kamis, 18 Februari 2016

Educational Attainment in the States

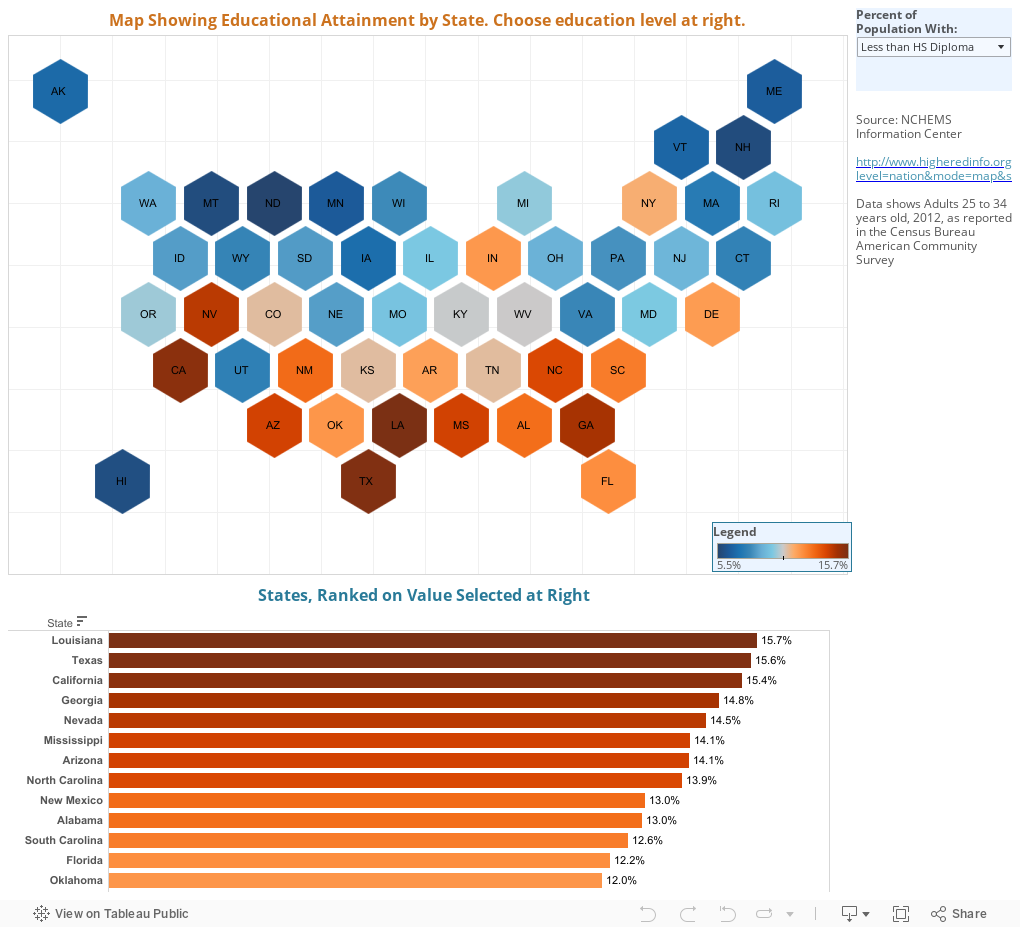
In case the coverage of the 2016 presidential election didn't convince you, this might help you see why people in the rest of the country seem different somehow.

The data are from the US Census Bureau's American Community Survey, in 2012; this shows the educational attainment of adults 25-34 in that year.  Use the control at top right to pick a value to display on the map, and the states (represented by hex boxes here) change color to show the value you've chosen.  The bar chart also updates.

There are seven values:


  • Less than a HS Diploma shows the percentage of the population in that state aged 25-34 that did not complete high school
  • HS Diploma or Less shows the number above plus the percentage of people who have just a high school diploma
  • Exactly a HS Diploma shows just that: Everyone who graduated from high school but did not continue
  • HS Diploma or Higher is the percentage with at least a high school diploma, including everyone who went beyond that
  • Bachelor's Degree shows people who have just a BA or a BS
  • Bachelor's Degree or Higher and Graduate Degree should be self explanatory
Once you make a selection, the map and the bar chart update; both are color-coded with blue numbers lower and orange numbers higher.  Be careful with this: With low attainment rates, blue is presumably better (at least if you work in higher education); with higher attainment rates, orange is better.  Hover over a state to see the value, or look at the bar chart at the bottom, which displays the same data in a different format.

You may notice the map style; this is the first time I've used it, and I like it a lot.  It allows you to see values on small states that would otherwise get lost on traditional maps; and it allows Alaska and Hawaii to display just off the coasts without a lot of effort.  But I'd like to know what you think about them, too.


- Hallo sahabat The secret, Pada Artikel yang anda baca kali ini dengan judul , kami telah mempersiapkan artikel ini dengan baik untuk anda baca dan ambil informasi didalamnya. mudah-mudahan isi postingan yang kami tulis ini dapat anda pahami. baiklah, selamat membaca.

Judul : Educational Attainment in the States
link : Educational Attainment in the States

Baca juga


In case the coverage of the 2016 presidential election didn't convince you, this might help you see why people in the rest of the country seem different somehow.

The data are from the US Census Bureau's American Community Survey, in 2012; this shows the educational attainment of adults 25-34 in that year.  Use the control at top right to pick a value to display on the map, and the states (represented by hex boxes here) change color to show the value you've chosen.  The bar chart also updates.

There are seven values:


  • Less than a HS Diploma shows the percentage of the population in that state aged 25-34 that did not complete high school
  • HS Diploma or Less shows the number above plus the percentage of people who have just a high school diploma
  • Exactly a HS Diploma shows just that: Everyone who graduated from high school but did not continue
  • HS Diploma or Higher is the percentage with at least a high school diploma, including everyone who went beyond that
  • Bachelor's Degree shows people who have just a BA or a BS
  • Bachelor's Degree or Higher and Graduate Degree should be self explanatory
Once you make a selection, the map and the bar chart update; both are color-coded with blue numbers lower and orange numbers higher.  Be careful with this: With low attainment rates, blue is presumably better (at least if you work in higher education); with higher attainment rates, orange is better.  Hover over a state to see the value, or look at the bar chart at the bottom, which displays the same data in a different format.

You may notice the map style; this is the first time I've used it, and I like it a lot.  It allows you to see values on small states that would otherwise get lost on traditional maps; and it allows Alaska and Hawaii to display just off the coasts without a lot of effort.  But I'd like to know what you think about them, too.


Kamis, 11 Februari 2016

Graduation Rates by Selectivity: Freshmen, 2007

This is the second part of my visualization of graduation rates from NCES. Part I is right below this one, or if  you want, you can click here to open it in a new window.

People in higher ed, and especially in government, talk a lot about graduation rates, and the presumption is this: That graduation rates are something we credit or blame on the colleges; that is, something a particular college does determines whether or not its graduation rate is high.  If Princeton stopped caring, presumably, its graduation rate would collapse.

Well, maybe.  Probably not, though.

We can see that a single factor, such as percentage of students in the freshman class with Pell, or the mean SAT score, can predict with some precision the graduation rate of a college or university.  If you don't believe me, see for yourself.

There is some variation in rates of colleges with similar profiles, of course, and people believe--correctly, or incorrectly, I'm not sure--that this is the important difference, or the value added by the particular college.  Maybe, but given the percentage of variance explained by single variables, I'm willing to guess other pre-college characteristics explain a lot of that unexplained variance.  Even as dull an instrument as US News and World Report realized years ago that having more Pell students lowered your graduation rate, all other things being equal.

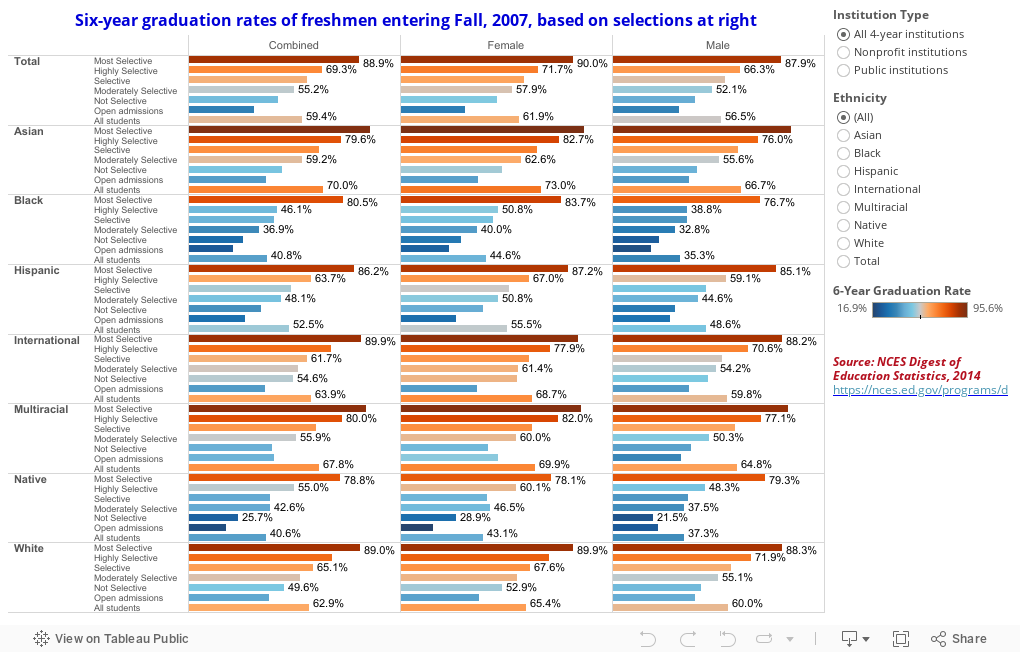
Which leads us to this: The entering freshman class of 2007, and their six-year graduation rate, broken out by gender, ethnicity, and the selectivity of the college. You can see the pattern: The more selective the school, the higher the graduation rate.

Consider this.  You are headmaster at a college where they only thing they teach is dunking a basketball.  At the end of the course of study, students are given a test: 100 attempts to dunk the basketball.  And your school has a dunk percentage of 74.3%, the highest in the nation, and far better than any other Dunking College in the US.  All the people in Tallsville, where you're located, are very proud of you, as you educate mostly local kids from Tallsville, named for the Tall family.

The next year, you get ten times as many applicants.  And, being a college that wants to turn out the best dunkers (it's in your strategic plan, of course), you are suddenly able to admit only the tallest applicants, with the biggest vertical jumps and the largest hands.  Using the same instructional tools you've always used, your dunking percentage skyrockets to 98.2%.  And next year, guess what happens to applications? And guess whom you select from that pool?

The nation's oldest and wealthiest colleges mostly had a head start of several hundred years on the rest of us. And in times when college was almost exclusively the bastion of wealthy, white men from the upper crust of society, they have long histories of turning out men who end up, not surprisingly, wealthy and white.

Their reputation ensures that their position in the market will be strong for as far as the eye can see, and will allow them to select only students who, albeit not always white, wealthy men anymore, are destined to graduate from college.  If you're a little less selective, you have a little less luxury of choice.  And so it goes.

There is, of course, nothing wrong with that.  But choosing a college because of its graduation rate is backwards: The college will select you based on your propensity to graduate. Ponder that.

Do you agree? Or not?  Either way, I'd love to hear from you.


- Hallo sahabat The secret, Pada Artikel yang anda baca kali ini dengan judul , kami telah mempersiapkan artikel ini dengan baik untuk anda baca dan ambil informasi didalamnya. mudah-mudahan isi postingan yang kami tulis ini dapat anda pahami. baiklah, selamat membaca.

Judul : Graduation Rates by Selectivity: Freshmen, 2007
link : Graduation Rates by Selectivity: Freshmen, 2007

Baca juga


This is the second part of my visualization of graduation rates from NCES. Part I is right below this one, or if  you want, you can click here to open it in a new window.

People in higher ed, and especially in government, talk a lot about graduation rates, and the presumption is this: That graduation rates are something we credit or blame on the colleges; that is, something a particular college does determines whether or not its graduation rate is high.  If Princeton stopped caring, presumably, its graduation rate would collapse.

Well, maybe.  Probably not, though.

We can see that a single factor, such as percentage of students in the freshman class with Pell, or the mean SAT score, can predict with some precision the graduation rate of a college or university.  If you don't believe me, see for yourself.

There is some variation in rates of colleges with similar profiles, of course, and people believe--correctly, or incorrectly, I'm not sure--that this is the important difference, or the value added by the particular college.  Maybe, but given the percentage of variance explained by single variables, I'm willing to guess other pre-college characteristics explain a lot of that unexplained variance.  Even as dull an instrument as US News and World Report realized years ago that having more Pell students lowered your graduation rate, all other things being equal.

Which leads us to this: The entering freshman class of 2007, and their six-year graduation rate, broken out by gender, ethnicity, and the selectivity of the college. You can see the pattern: The more selective the school, the higher the graduation rate.

Consider this.  You are headmaster at a college where they only thing they teach is dunking a basketball.  At the end of the course of study, students are given a test: 100 attempts to dunk the basketball.  And your school has a dunk percentage of 74.3%, the highest in the nation, and far better than any other Dunking College in the US.  All the people in Tallsville, where you're located, are very proud of you, as you educate mostly local kids from Tallsville, named for the Tall family.

The next year, you get ten times as many applicants.  And, being a college that wants to turn out the best dunkers (it's in your strategic plan, of course), you are suddenly able to admit only the tallest applicants, with the biggest vertical jumps and the largest hands.  Using the same instructional tools you've always used, your dunking percentage skyrockets to 98.2%.  And next year, guess what happens to applications? And guess whom you select from that pool?

The nation's oldest and wealthiest colleges mostly had a head start of several hundred years on the rest of us. And in times when college was almost exclusively the bastion of wealthy, white men from the upper crust of society, they have long histories of turning out men who end up, not surprisingly, wealthy and white.

Their reputation ensures that their position in the market will be strong for as far as the eye can see, and will allow them to select only students who, albeit not always white, wealthy men anymore, are destined to graduate from college.  If you're a little less selective, you have a little less luxury of choice.  And so it goes.

There is, of course, nothing wrong with that.  But choosing a college because of its graduation rate is backwards: The college will select you based on your propensity to graduate. Ponder that.

Do you agree? Or not?  Either way, I'd love to hear from you.


Selasa, 09 Februari 2016

Graduation Rates, Rolled Up

I like the NCES Digest of Education Statistics, but some of the reports they present are almost unusable.  If you've ever tried to visualize a report like this, you know what I mean.  If anyone from NCES is reading this, please help and encourage the good people there to put data in a cleaned, unformatted report.

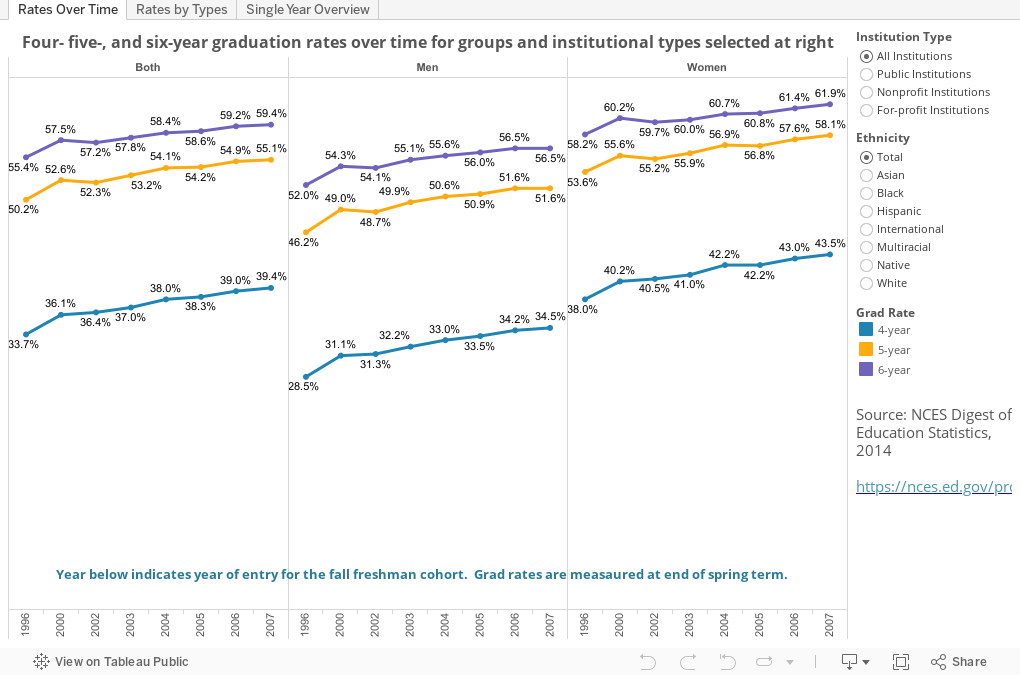
But, on to the data.  This is pretty simple, actually, and it bounces off previous visualizations I've done that show graduation rates are as much an input as an output.  The data are presented in three views: Over time, summarized for a single year, and by institutional type.  Click on the tabs to see them all, and use the filters on the right to select subsets.  You may want to look at women, or Hispanic students, for instance, and you can do so here.

There are some interesting patterns here.  It's clear that women, across the board, have higher graduation rates than men; and that colleges are not serving African American men very well.

What else do  you see? Anything surprising? Leave a comment below.

See this, too, for another way of looking at college graduation rates.


- Hallo sahabat The secret, Pada Artikel yang anda baca kali ini dengan judul , kami telah mempersiapkan artikel ini dengan baik untuk anda baca dan ambil informasi didalamnya. mudah-mudahan isi postingan yang kami tulis ini dapat anda pahami. baiklah, selamat membaca.

Judul : Graduation Rates, Rolled Up
link : Graduation Rates, Rolled Up

Baca juga


I like the NCES Digest of Education Statistics, but some of the reports they present are almost unusable.  If you've ever tried to visualize a report like this, you know what I mean.  If anyone from NCES is reading this, please help and encourage the good people there to put data in a cleaned, unformatted report.

But, on to the data.  This is pretty simple, actually, and it bounces off previous visualizations I've done that show graduation rates are as much an input as an output.  The data are presented in three views: Over time, summarized for a single year, and by institutional type.  Click on the tabs to see them all, and use the filters on the right to select subsets.  You may want to look at women, or Hispanic students, for instance, and you can do so here.

There are some interesting patterns here.  It's clear that women, across the board, have higher graduation rates than men; and that colleges are not serving African American men very well.

What else do  you see? Anything surprising? Leave a comment below.

See this, too, for another way of looking at college graduation rates.


Jumat, 05 Februari 2016

In-state enrollment and Pell

A recent article in the Washington Post piqued my interest: Why the University of Oregon turned to neighboring states for students, by colleague Roger Thompson.

Some of this is no surprise, of course. I've been looking at NCES and WICHE data for years, and even visualized the latter to show how demographics will change enrollment profiles at colleges across the country.

Lots of publics realize this, and lots have attempted to enroll larger numbers and percentages of students from outside their states. There's more to it than population, however: It's one of education's worst-kept secrets that students who travel farther to college come from families with higher incomes (or vice versa, of course), and in general, so do students who cross state lines for their education. Public universities have discovered that high out-of-state tuition makes them less desirable, and so have recently adopted a revenue maximization model, often offering large discounts to non-resident students.  It's generally better to get 70% of $30,000 than 0% of $30,000, especially when resident students might only pay $12,500, assuming the enrollment boost is sufficient.

This is a natural reaction by the universities in light of massive state funding cutbacks.

To boot, wealthier students have higher test scores, on average, and at prestigious-conscious universities, this can be an added bonus.

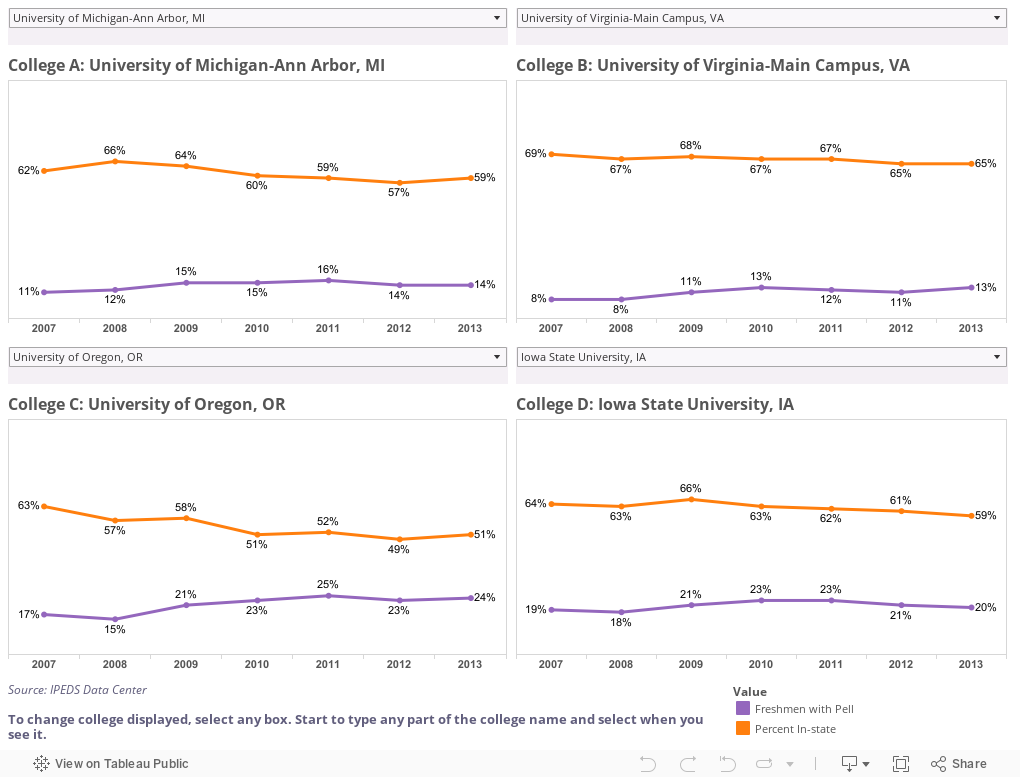
The danger, of course, is that this might exclude lower-income in-state students.  So, I took a look at the two factors over time at about 550 public colleges and universities.  The visualization below gives you the option to compare any four institutions by choosing the ones you want from the individual drop-down boxes: Orange lines show percent of freshmen from in-state; purple shows percent with Pell over time.  In order to select a college, just click on the box and start typing any part of the name. If you want UC Santa Cruz, for instance, you'll get better luck with "Cruz" than "California."

I started with four at random.  Make your own set.

What do you see? And are you surprised?

Note: Since I posted this, a colleague has pointed out that the IPEDS data are not sufficiently granular to separate in-state and out-of-state Pell students, which would have been the ideal way to look at this.  And, in addition, I'll add that a university could a) increase the percentage of its state's HS graduates enrolling, b) increase the number of Pell students, and c) see the percentage of Pell students go down if the freshman class grew substantially.


- Hallo sahabat The secret, Pada Artikel yang anda baca kali ini dengan judul , kami telah mempersiapkan artikel ini dengan baik untuk anda baca dan ambil informasi didalamnya. mudah-mudahan isi postingan yang kami tulis ini dapat anda pahami. baiklah, selamat membaca.

Judul : In-state enrollment and Pell
link : In-state enrollment and Pell

Baca juga


A recent article in the Washington Post piqued my interest: Why the University of Oregon turned to neighboring states for students, by colleague Roger Thompson.

Some of this is no surprise, of course. I've been looking at NCES and WICHE data for years, and even visualized the latter to show how demographics will change enrollment profiles at colleges across the country.

Lots of publics realize this, and lots have attempted to enroll larger numbers and percentages of students from outside their states. There's more to it than population, however: It's one of education's worst-kept secrets that students who travel farther to college come from families with higher incomes (or vice versa, of course), and in general, so do students who cross state lines for their education. Public universities have discovered that high out-of-state tuition makes them less desirable, and so have recently adopted a revenue maximization model, often offering large discounts to non-resident students.  It's generally better to get 70% of $30,000 than 0% of $30,000, especially when resident students might only pay $12,500, assuming the enrollment boost is sufficient.

This is a natural reaction by the universities in light of massive state funding cutbacks.

To boot, wealthier students have higher test scores, on average, and at prestigious-conscious universities, this can be an added bonus.

The danger, of course, is that this might exclude lower-income in-state students.  So, I took a look at the two factors over time at about 550 public colleges and universities.  The visualization below gives you the option to compare any four institutions by choosing the ones you want from the individual drop-down boxes: Orange lines show percent of freshmen from in-state; purple shows percent with Pell over time.  In order to select a college, just click on the box and start typing any part of the name. If you want UC Santa Cruz, for instance, you'll get better luck with "Cruz" than "California."

I started with four at random.  Make your own set.

What do you see? And are you surprised?

Note: Since I posted this, a colleague has pointed out that the IPEDS data are not sufficiently granular to separate in-state and out-of-state Pell students, which would have been the ideal way to look at this.  And, in addition, I'll add that a university could a) increase the percentage of its state's HS graduates enrolling, b) increase the number of Pell students, and c) see the percentage of Pell students go down if the freshman class grew substantially.


Rabu, 03 Februari 2016

Degrees awarded by Discipline, Ethnicity, and Gender, 2011 to 2013

This is three years of data from the NCES Digest of Education Statistics, breaking out all bachelor's degrees awarded by ethnicity, gender, and discipline.  For the sake of clarity, I rolled many of the disciplines together, and on at least one view, rolled up ethnicities into groups as well.

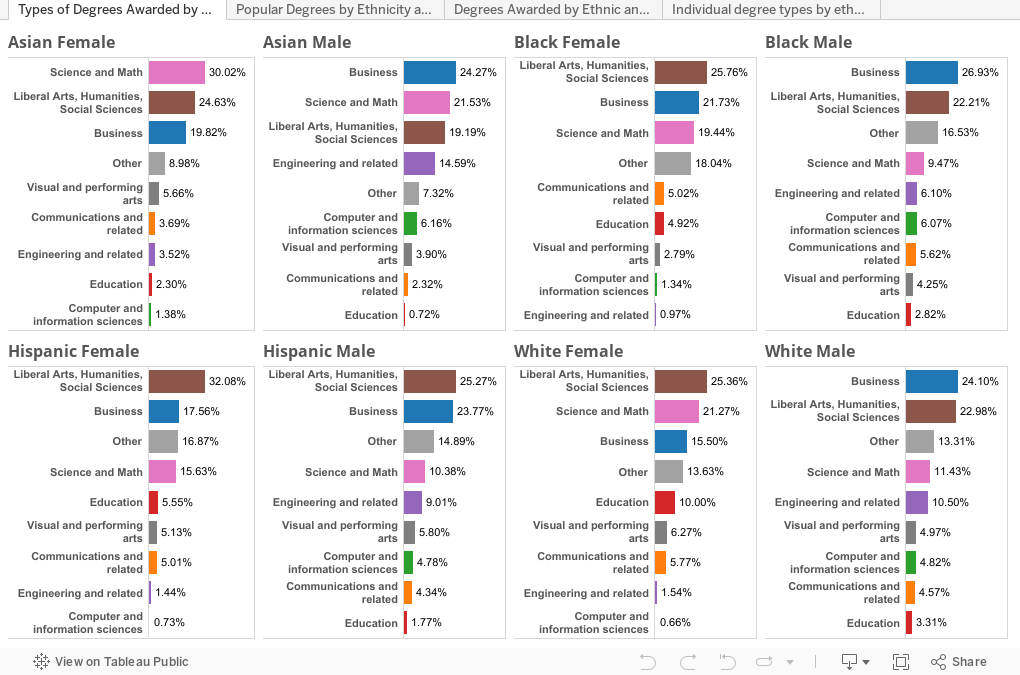
The first view simply takes a look at ethnicity and gender: What do Asian women, or Hispanic men study in college?  Eight views on one dashboard, showing some interesting stuff: 30% of Asian women study Science and Math, compared to just 9.5% of African American men.  Business always dominates with men, except Hispanic men.  Interesting.


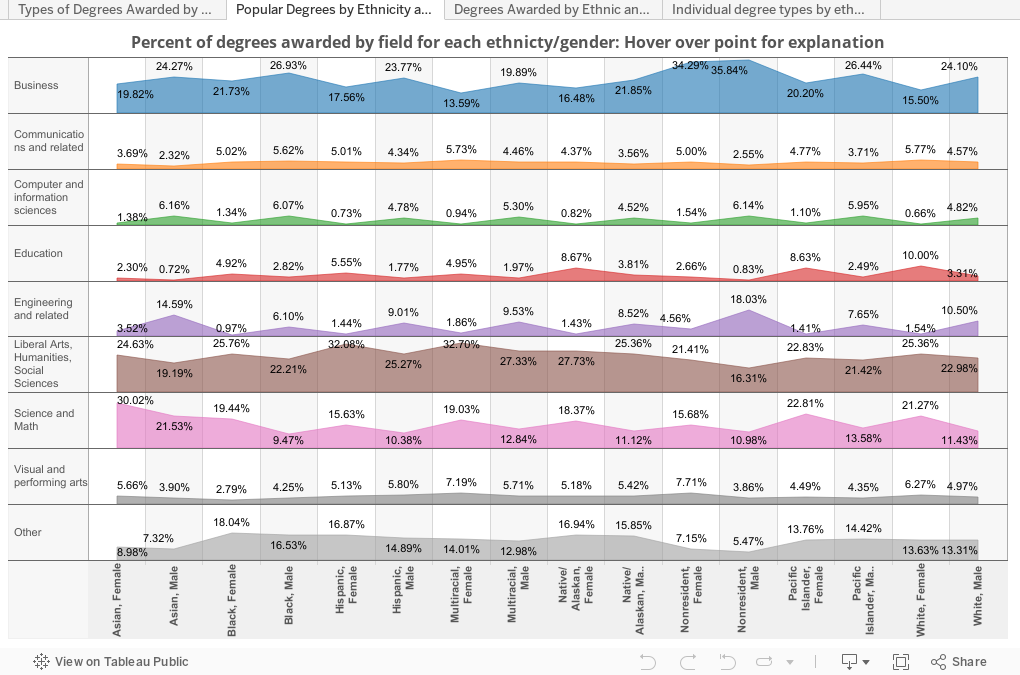
Behold the power of DataViz.  This view is the exact same day, just shown a different way to allow you to get a comparative view.  This shows all ethnic groups in the data set, however, and the data in columns adds up to 100%.  So, for instance, in the very top left, of all degrees awarded to Asian women, 19.82% were in business.  The figure is 34.3% for nonresident (international) men.


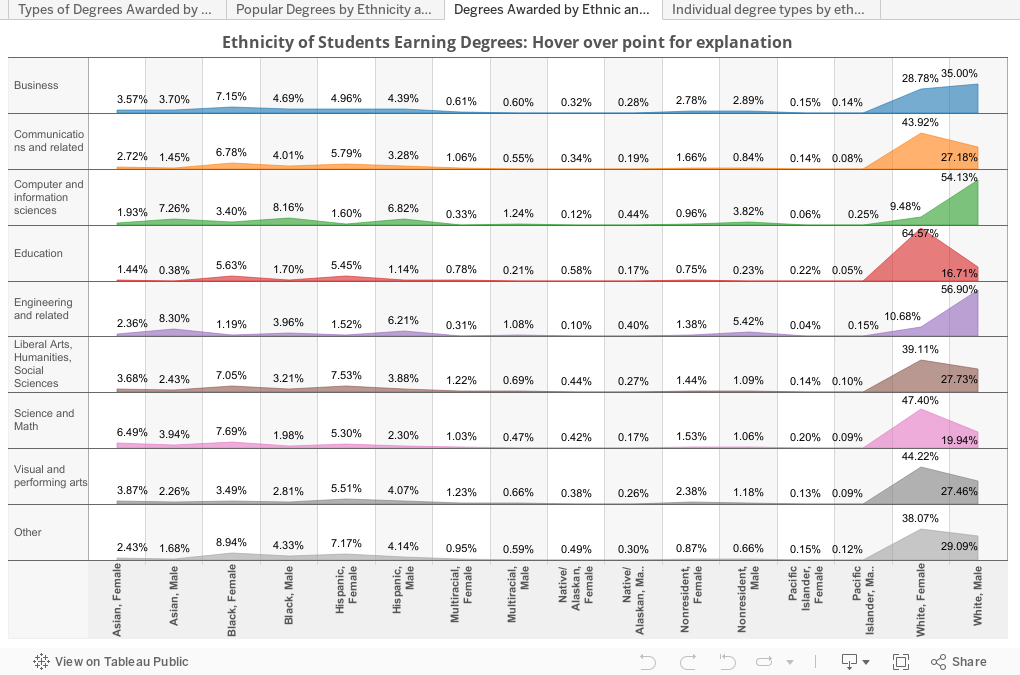
The third view turns it all around. Here you can see all the degrees awarded in a specific discipline in those three years, and see how they were distributed.  For instance, of all the degrees awarded in Education, 65% went to Caucasian women; of all the engineering degrees, 8.3% went to Asian males.


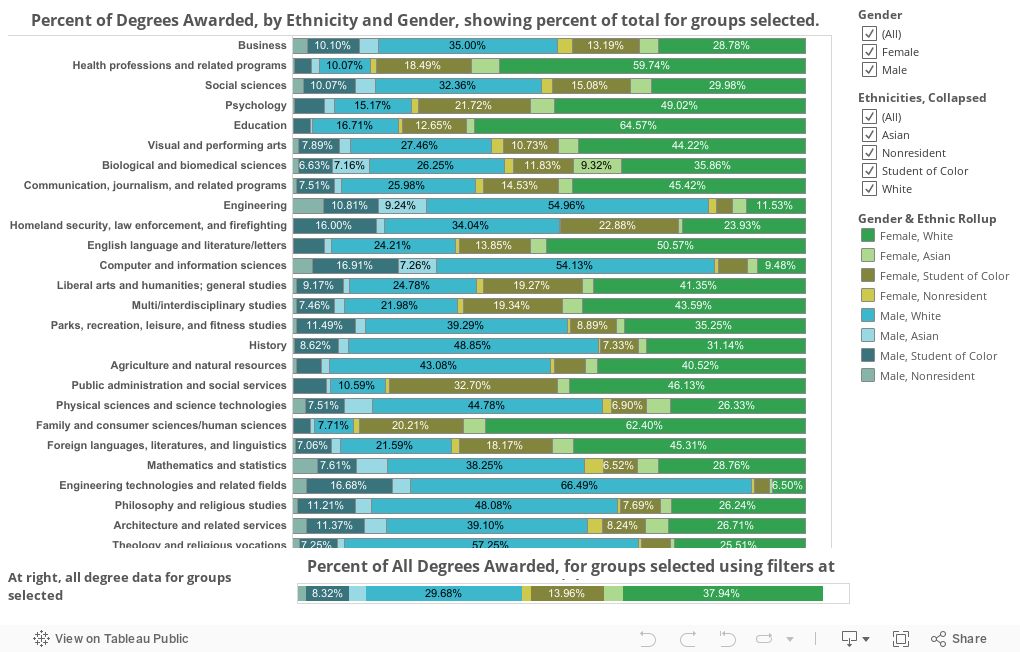
The fourth view is a little more complex, and allows you to create your own view.  For each discipline shown, the colored bars add up to 100% for the groups selected.  At first, it's a little noisy: Both men and women, and all ethnicities.  But this is where you can get interactive.  Look at just Hispanic students, for instance, by de-selecting every thing else; or see just men, if that's what you want.  The bars will always recalculate, and the very bottom bar rolls up all degrees into one bar, for comparison.

What do you see that jumps out at you?  Let me know in the comments at the bottom.

- Hallo sahabat The secret, Pada Artikel yang anda baca kali ini dengan judul , kami telah mempersiapkan artikel ini dengan baik untuk anda baca dan ambil informasi didalamnya. mudah-mudahan isi postingan yang kami tulis ini dapat anda pahami. baiklah, selamat membaca.

Judul : Degrees awarded by Discipline, Ethnicity, and Gender, 2011 to 2013
link : Degrees awarded by Discipline, Ethnicity, and Gender, 2011 to 2013

Baca juga


This is three years of data from the NCES Digest of Education Statistics, breaking out all bachelor's degrees awarded by ethnicity, gender, and discipline.  For the sake of clarity, I rolled many of the disciplines together, and on at least one view, rolled up ethnicities into groups as well.

The first view simply takes a look at ethnicity and gender: What do Asian women, or Hispanic men study in college?  Eight views on one dashboard, showing some interesting stuff: 30% of Asian women study Science and Math, compared to just 9.5% of African American men.  Business always dominates with men, except Hispanic men.  Interesting.


Behold the power of DataViz.  This view is the exact same day, just shown a different way to allow you to get a comparative view.  This shows all ethnic groups in the data set, however, and the data in columns adds up to 100%.  So, for instance, in the very top left, of all degrees awarded to Asian women, 19.82% were in business.  The figure is 34.3% for nonresident (international) men.


The third view turns it all around. Here you can see all the degrees awarded in a specific discipline in those three years, and see how they were distributed.  For instance, of all the degrees awarded in Education, 65% went to Caucasian women; of all the engineering degrees, 8.3% went to Asian males.


The fourth view is a little more complex, and allows you to create your own view.  For each discipline shown, the colored bars add up to 100% for the groups selected.  At first, it's a little noisy: Both men and women, and all ethnicities.  But this is where you can get interactive.  Look at just Hispanic students, for instance, by de-selecting every thing else; or see just men, if that's what you want.  The bars will always recalculate, and the very bottom bar rolls up all degrees into one bar, for comparison.

What do you see that jumps out at you?  Let me know in the comments at the bottom.

Senin, 25 Januari 2016

First Blog Post of 2016

Hey there! I'm back. There's been a lot of happenings in my life ever since I've stopped blogging. Looking through my blog archive, I've noticed my last post was from the month of September. As all of you know, year 2015 was not really my lucky year. From the start of the month of November 2015, I already have an intuition that something's going to happen soon. First was, I had the worst law school related incident. Second was, my Aunt, my mother's sister accidentally died due to accident by electrocution. Third was another school incident happened to our school where our new teacher punch a student during our Christmas party. Fourth, I was a victim of an unspeakable incident which I guess I'll take it to my grave. Fifth, my life is a complete mess due to my Aunt's early demise. 

So that's when I thought those incidents that happened last year 2015 had been completely buried and forgotten. When I came back to school after a very long vacation, another bomb exploded which completely divided the people in our school because of that particular person. Speculations, conjectures, and assumptions were made what's really behind that incident. The sad truth is I was also dragged by the issue but one thing for sure, it has nothing to do with me. It had something to do with another unspeakable truth which I guess I'm gonna carry it with me forever (hopefully not). Anyway, the truth will come out anytime soon or in the next few years. We don't really know what will happen in the future but I have a great fear that it will come out this year. People will talk and secrets will only be kept between two persons when the other one is dead. 

Another thing, according to my horoscope, this year is a bad year for me and my friendships. Well, it had just begun. Somebody betrayed me recently and it was really an evil issue. I must say that this friend of mine who gave me the information is truly a good person. She made me realized a lot of things about myself. I must say this person is for keeps. There are still some people out there that are authentic. I'm glad I've found one in my lifetime. This person finally won my loyalty. Oh God, just don't fuck up with this one. You know how loyal I am to my true friends but a bitch to those who pretended to be loyal to me. As to the famous quote that goes, "They are not really your friends unless they defended you in your absence". That's it! Sorry guys, I can't really divulge everything on this post. It's classified information. Until next post. 

Anyway, here are some photos I'd like to share from last year. Happy viewing!!! 
No class in LabRel. It's time for Karaoke. It's Brandon's treat anyway.

After Karaoke.

Accidentally reunited with my elementary classmate.

Picked up a gumamela (hibiscus) beside the road.

Dress up day

In the mood for photos. Me, not feeling cold anyway.

Ramen treat while reading torts and damages at TG.

TG selfie.

Photo taken after our Torts and Damages examination

I love this look. Bad Ass cute girl.

Freshmen classmates.

Welcoming our guest from Manila. 

New hair color after the Mercury Retrograde

My outfit of the day. Purple.

Attending an awarding ceremony.

Photo taken with Jaya, the soul diva before she'll present on stage.

After LabRel. Had a little bit of misunderstanding with Tryst.

Me and my baby boy persian Taigah Moonchee

Just loving my hair this day.

How my hair looks like from the back.

Had grocery for dog food.

Dinner at Chowking.

Chillin' at home.

Had lomi snack after this photo.

Alone in the classroom. Waiting for my classmates to arrive. 

- Hallo sahabat The secret, Pada Artikel yang anda baca kali ini dengan judul , kami telah mempersiapkan artikel ini dengan baik untuk anda baca dan ambil informasi didalamnya. mudah-mudahan isi postingan Artikel blog journal, Artikel partial confession, Artikel public diary, yang kami tulis ini dapat anda pahami. baiklah, selamat membaca.

Judul : First Blog Post of 2016
link : First Blog Post of 2016

Baca juga


Hey there! I'm back. There's been a lot of happenings in my life ever since I've stopped blogging. Looking through my blog archive, I've noticed my last post was from the month of September. As all of you know, year 2015 was not really my lucky year. From the start of the month of November 2015, I already have an intuition that something's going to happen soon. First was, I had the worst law school related incident. Second was, my Aunt, my mother's sister accidentally died due to accident by electrocution. Third was another school incident happened to our school where our new teacher punch a student during our Christmas party. Fourth, I was a victim of an unspeakable incident which I guess I'll take it to my grave. Fifth, my life is a complete mess due to my Aunt's early demise. 

So that's when I thought those incidents that happened last year 2015 had been completely buried and forgotten. When I came back to school after a very long vacation, another bomb exploded which completely divided the people in our school because of that particular person. Speculations, conjectures, and assumptions were made what's really behind that incident. The sad truth is I was also dragged by the issue but one thing for sure, it has nothing to do with me. It had something to do with another unspeakable truth which I guess I'm gonna carry it with me forever (hopefully not). Anyway, the truth will come out anytime soon or in the next few years. We don't really know what will happen in the future but I have a great fear that it will come out this year. People will talk and secrets will only be kept between two persons when the other one is dead. 

Another thing, according to my horoscope, this year is a bad year for me and my friendships. Well, it had just begun. Somebody betrayed me recently and it was really an evil issue. I must say that this friend of mine who gave me the information is truly a good person. She made me realized a lot of things about myself. I must say this person is for keeps. There are still some people out there that are authentic. I'm glad I've found one in my lifetime. This person finally won my loyalty. Oh God, just don't fuck up with this one. You know how loyal I am to my true friends but a bitch to those who pretended to be loyal to me. As to the famous quote that goes, "They are not really your friends unless they defended you in your absence". That's it! Sorry guys, I can't really divulge everything on this post. It's classified information. Until next post. 

Anyway, here are some photos I'd like to share from last year. Happy viewing!!! 
No class in LabRel. It's time for Karaoke. It's Brandon's treat anyway.

After Karaoke.

Accidentally reunited with my elementary classmate.

Picked up a gumamela (hibiscus) beside the road.

Dress up day

In the mood for photos. Me, not feeling cold anyway.

Ramen treat while reading torts and damages at TG.

TG selfie.

Photo taken after our Torts and Damages examination

I love this look. Bad Ass cute girl.

Freshmen classmates.

Welcoming our guest from Manila. 

New hair color after the Mercury Retrograde

My outfit of the day. Purple.

Attending an awarding ceremony.

Photo taken with Jaya, the soul diva before she'll present on stage.

After LabRel. Had a little bit of misunderstanding with Tryst.

Me and my baby boy persian Taigah Moonchee

Just loving my hair this day.

How my hair looks like from the back.

Had grocery for dog food.

Dinner at Chowking.

Chillin' at home.

Had lomi snack after this photo.

Alone in the classroom. Waiting for my classmates to arrive.