Advertisement

Jangan lupa olahraga biar nggak baper (ˇ▼ˇ)

Senin, 25 Januari 2016

First Blog Post of 2016

Hey there! I'm back. There's been a lot of happenings in my life ever since I've stopped blogging. Looking through my blog archive, I've noticed my last post was from the month of September. As all of you know, year 2015 was not really my lucky year. From the start of the month of November 2015, I already have an intuition that something's going to happen soon. First was, I had the worst law school related incident. Second was, my Aunt, my mother's sister accidentally died due to accident by electrocution. Third was another school incident happened to our school where our new teacher punch a student during our Christmas party. Fourth, I was a victim of an unspeakable incident which I guess I'll take it to my grave. Fifth, my life is a complete mess due to my Aunt's early demise. 

So that's when I thought those incidents that happened last year 2015 had been completely buried and forgotten. When I came back to school after a very long vacation, another bomb exploded which completely divided the people in our school because of that particular person. Speculations, conjectures, and assumptions were made what's really behind that incident. The sad truth is I was also dragged by the issue but one thing for sure, it has nothing to do with me. It had something to do with another unspeakable truth which I guess I'm gonna carry it with me forever (hopefully not). Anyway, the truth will come out anytime soon or in the next few years. We don't really know what will happen in the future but I have a great fear that it will come out this year. People will talk and secrets will only be kept between two persons when the other one is dead. 

Another thing, according to my horoscope, this year is a bad year for me and my friendships. Well, it had just begun. Somebody betrayed me recently and it was really an evil issue. I must say that this friend of mine who gave me the information is truly a good person. She made me realized a lot of things about myself. I must say this person is for keeps. There are still some people out there that are authentic. I'm glad I've found one in my lifetime. This person finally won my loyalty. Oh God, just don't fuck up with this one. You know how loyal I am to my true friends but a bitch to those who pretended to be loyal to me. As to the famous quote that goes, "They are not really your friends unless they defended you in your absence". That's it! Sorry guys, I can't really divulge everything on this post. It's classified information. Until next post. 

Anyway, here are some photos I'd like to share from last year. Happy viewing!!! 
No class in LabRel. It's time for Karaoke. It's Brandon's treat anyway.

After Karaoke.

Accidentally reunited with my elementary classmate.

Picked up a gumamela (hibiscus) beside the road.

Dress up day

In the mood for photos. Me, not feeling cold anyway.

Ramen treat while reading torts and damages at TG.

TG selfie.

Photo taken after our Torts and Damages examination

I love this look. Bad Ass cute girl.

Freshmen classmates.

Welcoming our guest from Manila. 

New hair color after the Mercury Retrograde

My outfit of the day. Purple.

Attending an awarding ceremony.

Photo taken with Jaya, the soul diva before she'll present on stage.

After LabRel. Had a little bit of misunderstanding with Tryst.

Me and my baby boy persian Taigah Moonchee

Just loving my hair this day.

How my hair looks like from the back.

Had grocery for dog food.

Dinner at Chowking.

Chillin' at home.

Had lomi snack after this photo.

Alone in the classroom. Waiting for my classmates to arrive. 

- Hallo sahabat The secret, Pada Artikel yang anda baca kali ini dengan judul , kami telah mempersiapkan artikel ini dengan baik untuk anda baca dan ambil informasi didalamnya. mudah-mudahan isi postingan Artikel blog journal, Artikel partial confession, Artikel public diary, yang kami tulis ini dapat anda pahami. baiklah, selamat membaca.

Judul : First Blog Post of 2016
link : First Blog Post of 2016

Baca juga


Hey there! I'm back. There's been a lot of happenings in my life ever since I've stopped blogging. Looking through my blog archive, I've noticed my last post was from the month of September. As all of you know, year 2015 was not really my lucky year. From the start of the month of November 2015, I already have an intuition that something's going to happen soon. First was, I had the worst law school related incident. Second was, my Aunt, my mother's sister accidentally died due to accident by electrocution. Third was another school incident happened to our school where our new teacher punch a student during our Christmas party. Fourth, I was a victim of an unspeakable incident which I guess I'll take it to my grave. Fifth, my life is a complete mess due to my Aunt's early demise. 

So that's when I thought those incidents that happened last year 2015 had been completely buried and forgotten. When I came back to school after a very long vacation, another bomb exploded which completely divided the people in our school because of that particular person. Speculations, conjectures, and assumptions were made what's really behind that incident. The sad truth is I was also dragged by the issue but one thing for sure, it has nothing to do with me. It had something to do with another unspeakable truth which I guess I'm gonna carry it with me forever (hopefully not). Anyway, the truth will come out anytime soon or in the next few years. We don't really know what will happen in the future but I have a great fear that it will come out this year. People will talk and secrets will only be kept between two persons when the other one is dead. 

Another thing, according to my horoscope, this year is a bad year for me and my friendships. Well, it had just begun. Somebody betrayed me recently and it was really an evil issue. I must say that this friend of mine who gave me the information is truly a good person. She made me realized a lot of things about myself. I must say this person is for keeps. There are still some people out there that are authentic. I'm glad I've found one in my lifetime. This person finally won my loyalty. Oh God, just don't fuck up with this one. You know how loyal I am to my true friends but a bitch to those who pretended to be loyal to me. As to the famous quote that goes, "They are not really your friends unless they defended you in your absence". That's it! Sorry guys, I can't really divulge everything on this post. It's classified information. Until next post. 

Anyway, here are some photos I'd like to share from last year. Happy viewing!!! 
No class in LabRel. It's time for Karaoke. It's Brandon's treat anyway.

After Karaoke.

Accidentally reunited with my elementary classmate.

Picked up a gumamela (hibiscus) beside the road.

Dress up day

In the mood for photos. Me, not feeling cold anyway.

Ramen treat while reading torts and damages at TG.

TG selfie.

Photo taken after our Torts and Damages examination

I love this look. Bad Ass cute girl.

Freshmen classmates.

Welcoming our guest from Manila. 

New hair color after the Mercury Retrograde

My outfit of the day. Purple.

Attending an awarding ceremony.

Photo taken with Jaya, the soul diva before she'll present on stage.

After LabRel. Had a little bit of misunderstanding with Tryst.

Me and my baby boy persian Taigah Moonchee

Just loving my hair this day.

How my hair looks like from the back.

Had grocery for dog food.

Dinner at Chowking.

Chillin' at home.

Had lomi snack after this photo.

Alone in the classroom. Waiting for my classmates to arrive. 

Kamis, 21 Januari 2016

2014 IPEDS Admissions Data

This is always a popular post: Statistics on the entering class of 2014 at about 1900 colleges and universities across the country.  It's based on IPEDS data, which I downloaded from the IPEDS data center and conditioned.  The source file is here, if you'd like to do something with it yourself.

This year, NCES only reports test score ranges for those colleges and universities that require tests for all applicants; in some regard, this makes sense, but it's unfortunate.  At my institution, for instance, about 94% of enrolling students submit tests, and this data might be helpful to students who do plan to apply with tests.  I plan to let NCES know this was not a good idea, and you can, too, if you'd like.  For now you'll know why these colleges don't show up.  You'll have to check with the colleges themselves.

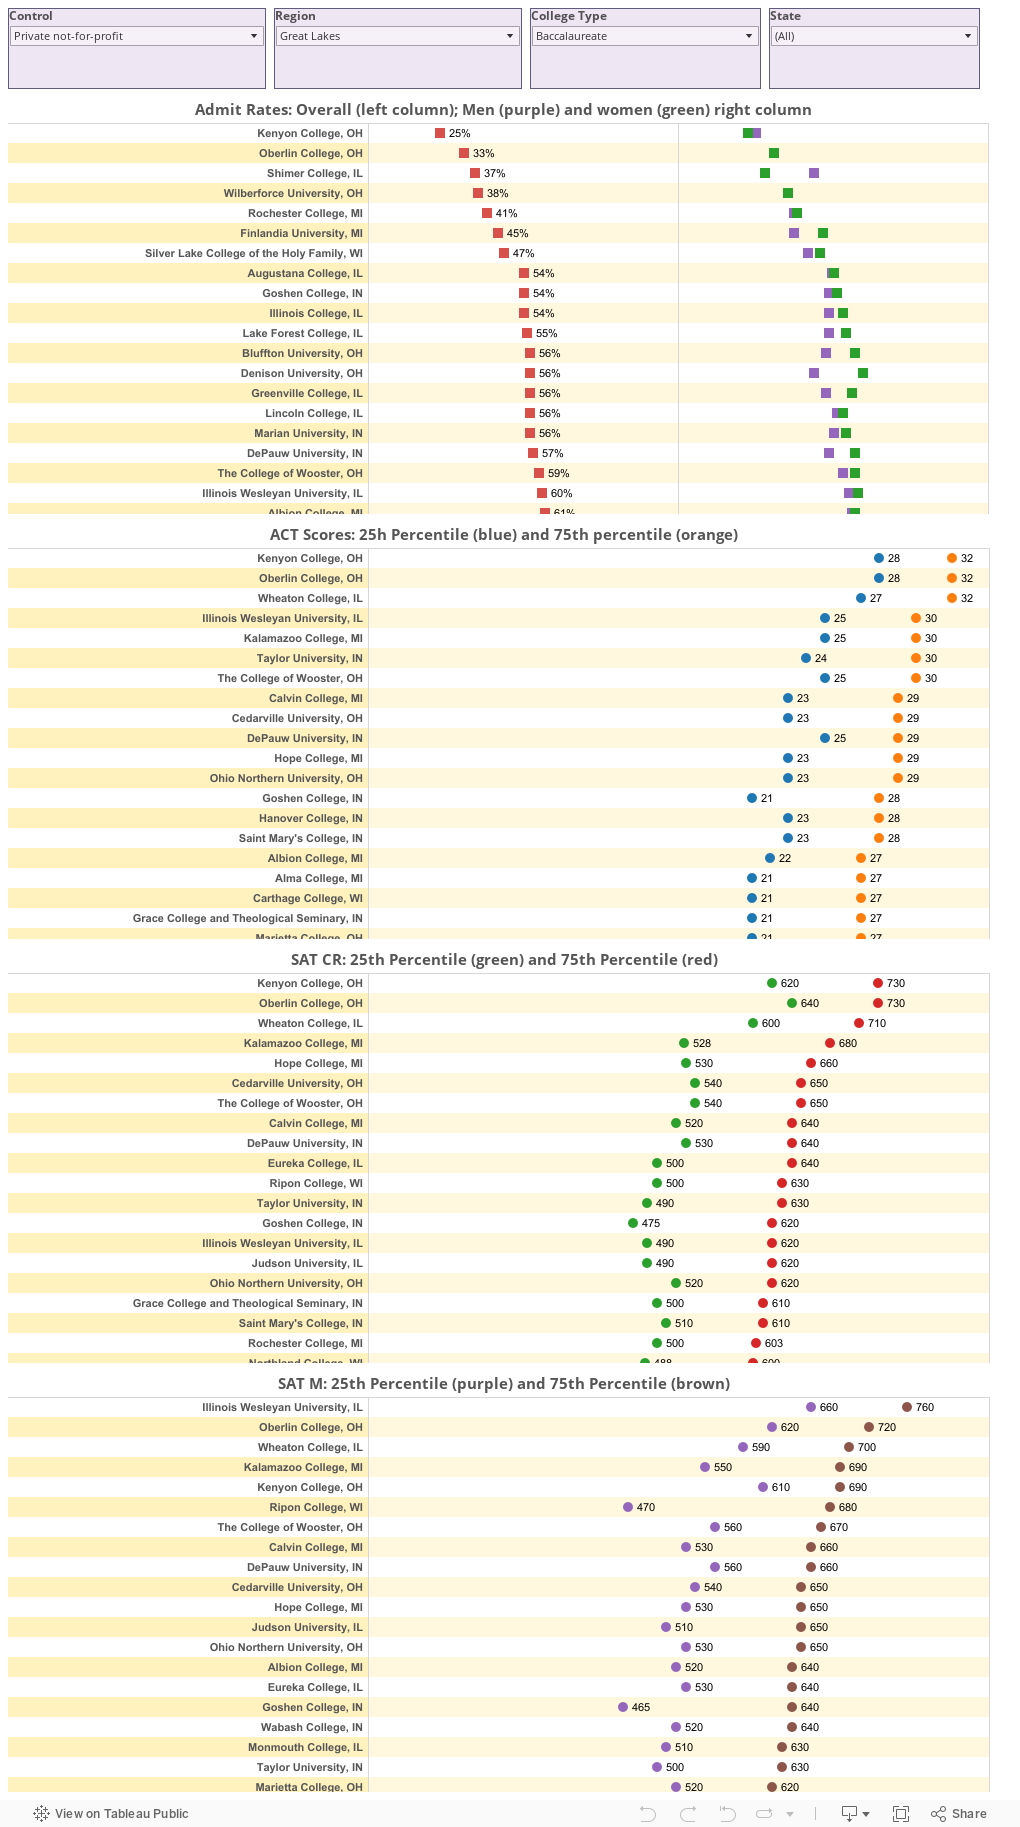
This view starts with private, Liberal Arts Colleges in the Great Lakes region, but you can make the list be whatever you want using the filters across the top.  Be aware that if you select "New England," for instance, you can't then select "Florida" until you re-set the region filter.

The views from the top down are:


  • Admit rates, with the overall rate on the left, and men and women on the right
  • ACT Scores, at the 25th and 75th percentile
  • SAT CR Scores, at the 25th and 75th percentile
  • SAT M Scores, at the 25th and 75th percentile
You'll have to scroll down to see them all four boxes, and within each box, use the scroll bar.


- Hallo sahabat The secret, Pada Artikel yang anda baca kali ini dengan judul , kami telah mempersiapkan artikel ini dengan baik untuk anda baca dan ambil informasi didalamnya. mudah-mudahan isi postingan yang kami tulis ini dapat anda pahami. baiklah, selamat membaca.

Judul : 2014 IPEDS Admissions Data
link : 2014 IPEDS Admissions Data

Baca juga


This is always a popular post: Statistics on the entering class of 2014 at about 1900 colleges and universities across the country.  It's based on IPEDS data, which I downloaded from the IPEDS data center and conditioned.  The source file is here, if you'd like to do something with it yourself.

This year, NCES only reports test score ranges for those colleges and universities that require tests for all applicants; in some regard, this makes sense, but it's unfortunate.  At my institution, for instance, about 94% of enrolling students submit tests, and this data might be helpful to students who do plan to apply with tests.  I plan to let NCES know this was not a good idea, and you can, too, if you'd like.  For now you'll know why these colleges don't show up.  You'll have to check with the colleges themselves.

This view starts with private, Liberal Arts Colleges in the Great Lakes region, but you can make the list be whatever you want using the filters across the top.  Be aware that if you select "New England," for instance, you can't then select "Florida" until you re-set the region filter.

The views from the top down are:


  • Admit rates, with the overall rate on the left, and men and women on the right
  • ACT Scores, at the 25th and 75th percentile
  • SAT CR Scores, at the 25th and 75th percentile
  • SAT M Scores, at the 25th and 75th percentile
You'll have to scroll down to see them all four boxes, and within each box, use the scroll bar.


Jumat, 15 Januari 2016

The latest Boogey Man: Frontloading

It's happened three times in the last several months: I am invited into, or stumble into, a discussion on "Frontloading."  It's been the case that the people who are talking about it are generally convinced it exists, and generally believe it's a widely practiced approach.

In case you don't know, frontloading is the presumed practice of enrollment managers (of course) who make big institutional aid awards to entice freshmen to enroll, and then remove them after the freshman year.  Journalists, especially, point to aggregated data suggesting that the average amount of institutional aid for non-freshmen is lower than for freshmen. "Aha!" they scream, "The smoking gun!"

Well, not so fast.  I'm willing to admit that there may be a few colleges in the US where frontloading happens, probably in a clandestine manner, but perhaps, in at least one instance I was made aware of, for a very logical and justifiable reason.  But most enrollment managers I've asked have the same reaction to the concept: To do so would be career suicide.  This does not deter those who love to skewer enrollment management and hoist the problems of higher education squarely on our backs.

To be sure, I asked a Facebook group of 9,000 college admissions officers, high school counselors, and independent college consultants about the practice.  This is not a group of wallflowers, and the group members call it like they see it; even so, I asked them to message me privately if there were colleges where this routinely happened.  I got a couple of "I think maybe it happens," responses, and exactly one comment from a counselor who said she was sure it happened.

I have told people repeatedly that there are many possible reasons why the data look the way they do:


  • The freshman data is first-time, full-time, degree seeking students.  All of them are technically eligible for institutional aid.
  • The "All students" data includes all undergraduates.  That includes full-time, part-time, non-degree seeking students, many of whom are less likely to qualify for aid.
  • The "All students" group also contains transfers, who may qualify for less aid
  • It's possible that students who earned aid as a freshman lose it due to lack of academic progress or performance in subsequent years
  • It's also possible students with the most institutional aid are the neediest, and thus not likely to be around past the freshman year
These reasons seem to fall on deaf ears of people who are eager to prove something they believe to be true.

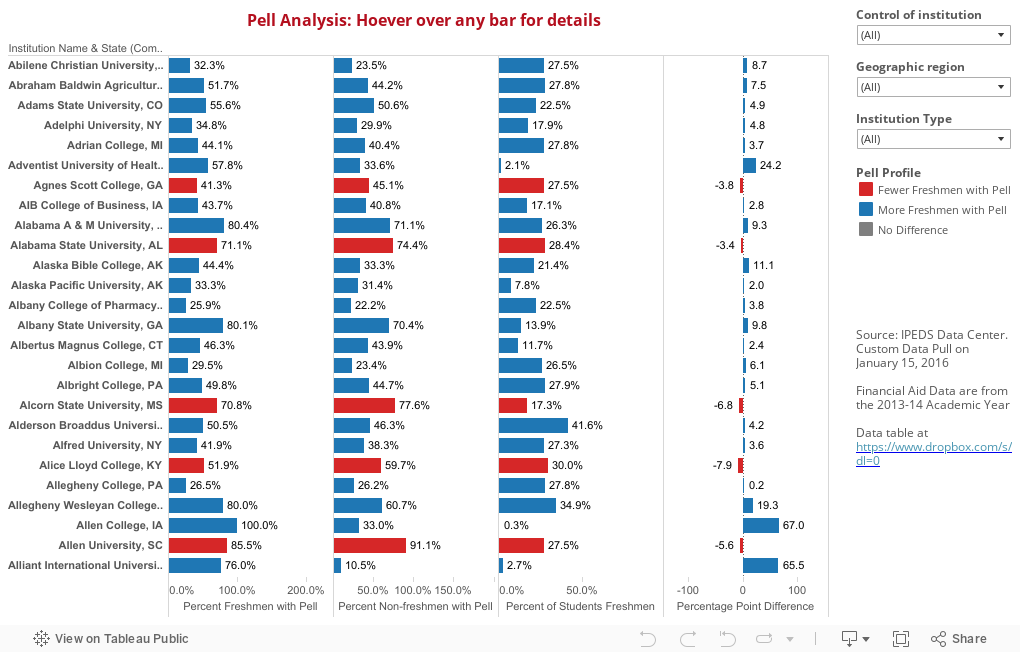
So I tried another angle: Doing the same comparison of Pell Grant participation.  The Pell Grant, of course, is a federal program, not awarded by or controlled by the colleges.  What would happen if we looked at Pell Grant participation rates among freshmen and the rest of the student body?  I think this visualization, below, demonstrates it quite well.

There are four columns: 

  • Percent of freshmen with Pell
  • Percent of all other undergraduates (non-freshmen) with Pell
  • The percentage of undergraduates who are freshmen (in a traditional college, this should be about 25%-30%.  Bigger or smaller numbers can tip off a different mix)
  • And finally, the right hand column, showing the difference between the first two.
The bars are color-coded: Blue bars show more freshmen with Pell; red bars show fewer freshmen with Pell, and gray bars show no difference.  You'll note that most bars are blue; if this were institutional aid, you might leap to the conclusion of frontloading.  That's exactly what journalists do.

But it's not institutional aid.  It's federal aid.  And yet, the differences are very large at some places.

You can hover over the top of any column to sort by that column.  And you can use the filters at the right to limit the colleges included on the view to certain regions, control, or Carnegie type.

Is this evidence strong enough to convince you?  If not, let me know why in the comments below.


- Hallo sahabat The secret, Pada Artikel yang anda baca kali ini dengan judul , kami telah mempersiapkan artikel ini dengan baik untuk anda baca dan ambil informasi didalamnya. mudah-mudahan isi postingan yang kami tulis ini dapat anda pahami. baiklah, selamat membaca.

Judul : The latest Boogey Man: Frontloading
link : The latest Boogey Man: Frontloading

Baca juga


It's happened three times in the last several months: I am invited into, or stumble into, a discussion on "Frontloading."  It's been the case that the people who are talking about it are generally convinced it exists, and generally believe it's a widely practiced approach.

In case you don't know, frontloading is the presumed practice of enrollment managers (of course) who make big institutional aid awards to entice freshmen to enroll, and then remove them after the freshman year.  Journalists, especially, point to aggregated data suggesting that the average amount of institutional aid for non-freshmen is lower than for freshmen. "Aha!" they scream, "The smoking gun!"

Well, not so fast.  I'm willing to admit that there may be a few colleges in the US where frontloading happens, probably in a clandestine manner, but perhaps, in at least one instance I was made aware of, for a very logical and justifiable reason.  But most enrollment managers I've asked have the same reaction to the concept: To do so would be career suicide.  This does not deter those who love to skewer enrollment management and hoist the problems of higher education squarely on our backs.

To be sure, I asked a Facebook group of 9,000 college admissions officers, high school counselors, and independent college consultants about the practice.  This is not a group of wallflowers, and the group members call it like they see it; even so, I asked them to message me privately if there were colleges where this routinely happened.  I got a couple of "I think maybe it happens," responses, and exactly one comment from a counselor who said she was sure it happened.

I have told people repeatedly that there are many possible reasons why the data look the way they do:


  • The freshman data is first-time, full-time, degree seeking students.  All of them are technically eligible for institutional aid.
  • The "All students" data includes all undergraduates.  That includes full-time, part-time, non-degree seeking students, many of whom are less likely to qualify for aid.
  • The "All students" group also contains transfers, who may qualify for less aid
  • It's possible that students who earned aid as a freshman lose it due to lack of academic progress or performance in subsequent years
  • It's also possible students with the most institutional aid are the neediest, and thus not likely to be around past the freshman year
These reasons seem to fall on deaf ears of people who are eager to prove something they believe to be true.

So I tried another angle: Doing the same comparison of Pell Grant participation.  The Pell Grant, of course, is a federal program, not awarded by or controlled by the colleges.  What would happen if we looked at Pell Grant participation rates among freshmen and the rest of the student body?  I think this visualization, below, demonstrates it quite well.

There are four columns: 

  • Percent of freshmen with Pell
  • Percent of all other undergraduates (non-freshmen) with Pell
  • The percentage of undergraduates who are freshmen (in a traditional college, this should be about 25%-30%.  Bigger or smaller numbers can tip off a different mix)
  • And finally, the right hand column, showing the difference between the first two.
The bars are color-coded: Blue bars show more freshmen with Pell; red bars show fewer freshmen with Pell, and gray bars show no difference.  You'll note that most bars are blue; if this were institutional aid, you might leap to the conclusion of frontloading.  That's exactly what journalists do.

But it's not institutional aid.  It's federal aid.  And yet, the differences are very large at some places.

You can hover over the top of any column to sort by that column.  And you can use the filters at the right to limit the colleges included on the view to certain regions, control, or Carnegie type.

Is this evidence strong enough to convince you?  If not, let me know why in the comments below.


Rabu, 06 Januari 2016

In Which I Break the Rules

I've had a long-standing rule when publishing to this blog: I don't take requests.  This is for two reasons: First, I do this for fun, and I publish what's interesting to me, hoping you'll find it compelling as well.  Second, the tools available now allow you to answer your own questions fairly easily.  If you like my visualizations but want to ask some more questions, you can download free versions of Tableau Public and explore to your heart's content.

But yesterday, when I published this piece on freshman migration, a topic that generated a lot of interest this time and the first time I did it, I admitted this was the most fun I had exploring data.  And I also admitted that I had dozens of views lined up, but, in the interest of keeping things simple, kept just two.

Since it's gone live, I've had about 20 people ask me "Could you look at this data this way?" questions.  That's exciting, because I'm always hoping what I publish generates as many questions as it answers.

So, for once, I'm taking requests.  And, even some suggestions. specifically from Ian Pytlarz and Carolyn Rockafellow of a Google+ Group for Higher Ed users of Tableau.  Thanks to them.

Six views here, all in one workbook, and accessible via tabs across the top:


  • State exports: Numbers and percentages in a scatter
  • State "stay homes: Numbers and percentages in a scatter
  • Bar charts of exports, showing number and percentages.  You can sort by either column
  • Pie charts of all 50 states and DC: (Another rule I broke, as pie charts are not very good for such things, but some people like them, and if you don't you can skip them and get the information elsewhere)
  • Individual college enrollments by in-state/out-of-state, or in-region/out-of-region
  • Enrollments in colleges within a state in aggregate, showing percentage from in-state and out-of-state
But that's it!  I may do some more internal analysis for our own use here at DePaul, but if you want more, you can make yourself data independent (and I'd love to see what you do with this!)


- Hallo sahabat The secret, Pada Artikel yang anda baca kali ini dengan judul , kami telah mempersiapkan artikel ini dengan baik untuk anda baca dan ambil informasi didalamnya. mudah-mudahan isi postingan yang kami tulis ini dapat anda pahami. baiklah, selamat membaca.

Judul : In Which I Break the Rules
link : In Which I Break the Rules

Baca juga


I've had a long-standing rule when publishing to this blog: I don't take requests.  This is for two reasons: First, I do this for fun, and I publish what's interesting to me, hoping you'll find it compelling as well.  Second, the tools available now allow you to answer your own questions fairly easily.  If you like my visualizations but want to ask some more questions, you can download free versions of Tableau Public and explore to your heart's content.

But yesterday, when I published this piece on freshman migration, a topic that generated a lot of interest this time and the first time I did it, I admitted this was the most fun I had exploring data.  And I also admitted that I had dozens of views lined up, but, in the interest of keeping things simple, kept just two.

Since it's gone live, I've had about 20 people ask me "Could you look at this data this way?" questions.  That's exciting, because I'm always hoping what I publish generates as many questions as it answers.

So, for once, I'm taking requests.  And, even some suggestions. specifically from Ian Pytlarz and Carolyn Rockafellow of a Google+ Group for Higher Ed users of Tableau.  Thanks to them.

Six views here, all in one workbook, and accessible via tabs across the top:


  • State exports: Numbers and percentages in a scatter
  • State "stay homes: Numbers and percentages in a scatter
  • Bar charts of exports, showing number and percentages.  You can sort by either column
  • Pie charts of all 50 states and DC: (Another rule I broke, as pie charts are not very good for such things, but some people like them, and if you don't you can skip them and get the information elsewhere)
  • Individual college enrollments by in-state/out-of-state, or in-region/out-of-region
  • Enrollments in colleges within a state in aggregate, showing percentage from in-state and out-of-state
But that's it!  I may do some more internal analysis for our own use here at DePaul, but if you want more, you can make yourself data independent (and I'd love to see what you do with this!)


Selasa, 05 Januari 2016

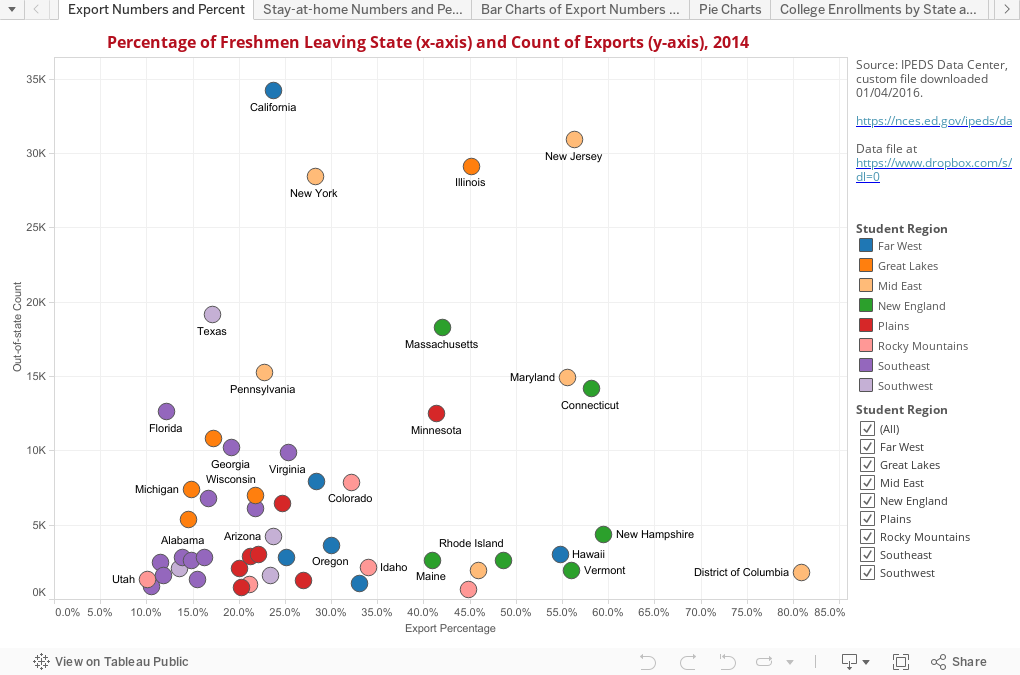
Freshman Migration, 2014

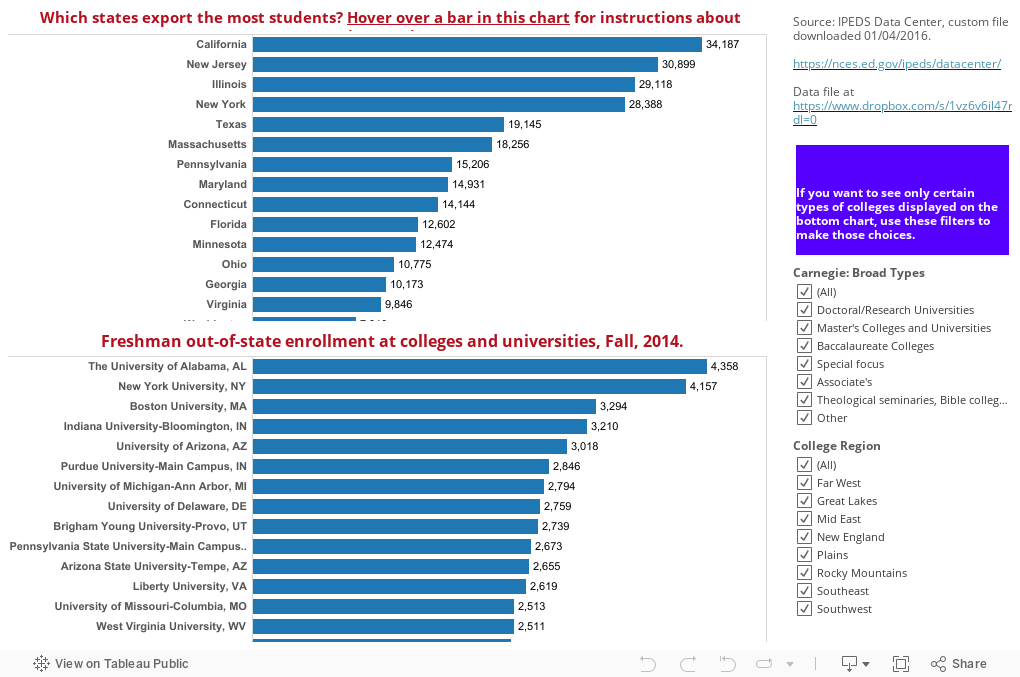
Note: Please be sure to hover over a bar on the first chart, below, to see how to interact.

When I was a kid, I was fascinated by license plates on cars.  And whenever I found myself in a college parking lot, it was like a buffet, with lots of plates from distant states. Thus, my fascination with freshman migration and out-of-state enrollment was born.

IPEDS has finally released 2014 Fall enrollment data, and that means the bi-annual availability of the freshman migration data.  I like visualizing this for two reasons: First, I can think of dozens of ways to show it, all of them interesting to me, and maybe to you, too.  Second, the data is so multi-faceted that it requires viewers to interact, something I've preached about for years: Don't let me decide which data is interesting; decide for yourself how you want to view it.

There are two ways I've presented it here.  On the first, you start by looking at the states that exported the most freshmen in 2014.  If you want to look at the colleges those students attended, just click on the state bar in the top view; the destination colleges below update.  If you only want to look at liberal arts colleges, or colleges in the Southeast, you can do that using the filters.  Remember, there is a reset button at the bottom of the visualization.  You can't break it.

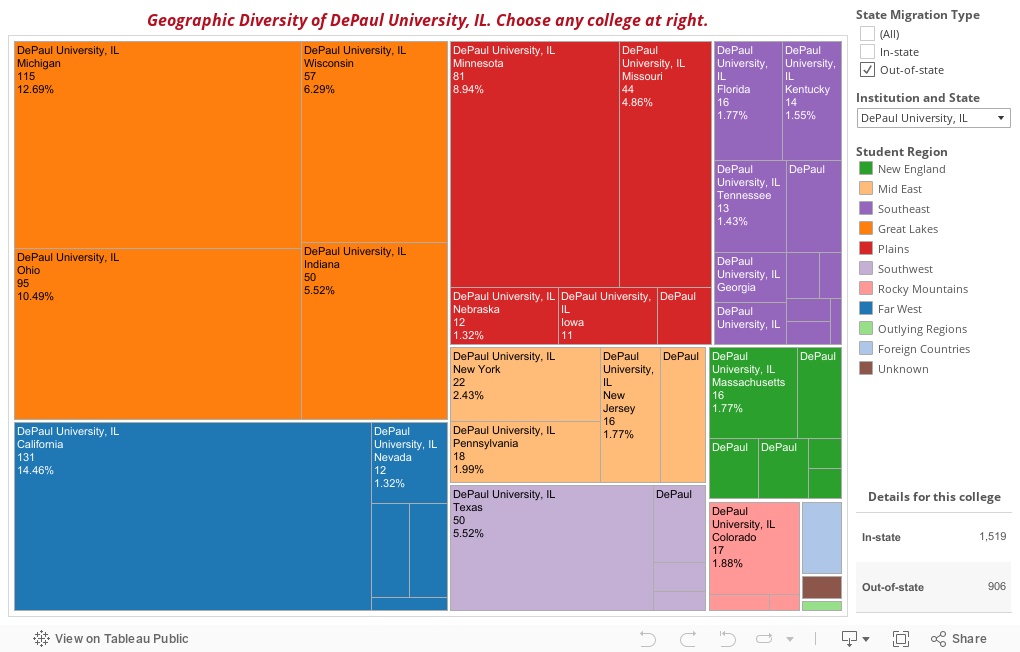
The second view shows individual colleges; I've started with my own.  You can see where the 2014 class came from.  First select All students or just Out-of-state students, depending on your interest. The tree map updates to show both regions (in color) and states (each square).  Hover for details.

What do you see? And do you like this as much as I do?

(As always, data presented is believed to be accurate, but there are occasional problems with IPEDS, including incorrect and missing data).


- Hallo sahabat The secret, Pada Artikel yang anda baca kali ini dengan judul , kami telah mempersiapkan artikel ini dengan baik untuk anda baca dan ambil informasi didalamnya. mudah-mudahan isi postingan yang kami tulis ini dapat anda pahami. baiklah, selamat membaca.

Judul : Freshman Migration, 2014
link : Freshman Migration, 2014

Baca juga


Note: Please be sure to hover over a bar on the first chart, below, to see how to interact.

When I was a kid, I was fascinated by license plates on cars.  And whenever I found myself in a college parking lot, it was like a buffet, with lots of plates from distant states. Thus, my fascination with freshman migration and out-of-state enrollment was born.

IPEDS has finally released 2014 Fall enrollment data, and that means the bi-annual availability of the freshman migration data.  I like visualizing this for two reasons: First, I can think of dozens of ways to show it, all of them interesting to me, and maybe to you, too.  Second, the data is so multi-faceted that it requires viewers to interact, something I've preached about for years: Don't let me decide which data is interesting; decide for yourself how you want to view it.

There are two ways I've presented it here.  On the first, you start by looking at the states that exported the most freshmen in 2014.  If you want to look at the colleges those students attended, just click on the state bar in the top view; the destination colleges below update.  If you only want to look at liberal arts colleges, or colleges in the Southeast, you can do that using the filters.  Remember, there is a reset button at the bottom of the visualization.  You can't break it.

The second view shows individual colleges; I've started with my own.  You can see where the 2014 class came from.  First select All students or just Out-of-state students, depending on your interest. The tree map updates to show both regions (in color) and states (each square).  Hover for details.

What do you see? And do you like this as much as I do?

(As always, data presented is believed to be accurate, but there are occasional problems with IPEDS, including incorrect and missing data).


Kamis, 31 Desember 2015

Review Snail Camera

REVIEW SNAIL CAMERA


Snail Camera merupakan sebuah aplikasi kamera yang dibuat untuk android. Snail Camera terdiri dari dua macam yaitu Snail Camera versi gratis, dan Snail Camera Pro yang berbayar. Kali ini kita akan membahas tentang aplikasi ini.
Snail Camera mempunyai sebuah tampilan yang dibilang cukup simple, dengan semua bentuk pilihan entah itu menu dan tombol mengambil gambar ada disebelah kanan.


Dan yang ada di atas merupakan tampilan dari Snail Camera. Yang ditampilkan diatas merupakan tampilan dari Snail Camera Pro, dengan kamera yang sengaja ditutup.
Dalam Snail Camera terdapat beberapa pilihan mode pengambilan gambar antara lain sebagai berikut:
1.       Normal Mode
2.       Enhanced Mode
3.       Multi Mode
4.       Bulb Mode


      Normal Mode

Normal Mode merupakan mode pengambilan gambar seperti biasa saja, bisa ditambahkan dengan beberapa efek ataupun pengaturan yang lain (Untuk bagian efek ataupun pengaturan lain berada dibawah). Dan Normal Mode merupakan mode awal dimana ketika kita membuka aplikasi Snail Camera.

   Enhanced Mode

Enhanced Mode, tentunya anda bertanya apa fungsi dari Enhanced Mode? Jika dilihat dengan sekilas Enhanced Mode terlihat sama seperti Normal Mode. Namun, jika diperhatikan dengan seksama dibawah pilihan shutter ada pengaturan warna, nah hal ini yang merupakan kegunaan dari Enhanced Mode.
Catatan: Pengaturan warna yang dimaksud adalah lingkaran yang ada di sebelah kiri kotak yang berwarna hijau. Dan kotak hijau tersebut adalah kotak perintah jika diaktifkan maka kotak itu berwarna hijau. Perintah tersebut meliputi pengaturan warna yang kita atur dari dari lingkaran yang ada di sebelah kotak tersebut.


Pada gambar diatas terdapat tiga pilihan yang bisa dinaikkan atau diturunkan (Ke kanan dan ke kiri). Pilihan pertama yaitu sebagai pengatur kecerahan warna, pilihan kedua yaitu pewarnaan hitam dan putih atau disebut BW, pilihan ketiga adalah satruasi warna.
Multi Mode


Multi Mode merupakan suatu pilihan dimana kita dapat mengambil sebuah foto dengan beberapa kali dengan background yang sama ataupun berbeda dan diolah menjadi satu foto.
Dari gambar diatas dapat kita lihat dibawah tombol shutter terdapat gambar dan gambar itu merupakan suatu pilihan “selesai, silahkan olah” yang akan kita tekan ketika sudah selesai mengambil foto. Dibawahnya gambar tersebut terdapat tulisan “0exp” itu berarti menunjukkan jumlah frame yang telah anda ambil untuk dijadikan satu foto. Jika anda telah mengambil foto sebanyak 2 kali maka tulisan tersebut akan berubah menjadi “2exp”.
Selanjutnya terdapat kotak hijau yang berarti “Ya” atau “tidak”. Sebelum membahas kotak hijau tersebut, saya akan menjelaskan tentang gambar mata yang anda lihat disebelah kotak tersebut. Gambar mata tersebut mengartikan “tampilkan frame jika anda telah memotret satu kali dan ingin melihat hasil sementara jika anda ingin meemotret sekali lagi sampai anda akhirnya selesai”. Dari penjelasan gambar mata tersebut tentunya anda mengerti apa maksud dari kotak hijau tersebut. Silahkan anda coba pada aplikasi Snail Camera anda.

 Bulb Mode


Bulb Mode, merupakan suatu mode pembukaan lensa kamera sehingga membuat kamera dapat menangkap cahaya ataupun apapun yang bergegak sehingga meninggalkan jejak. Mode ini sama seperti mode Slow pada kamera DSLR ataupun pada aplikasi Camera FV-5.
Untuk lebih mengetahui, Bulb Mode terdapat berbagai macam pilihan yang dapat kita lihat pada gambar yang ada dibawah tombol shutter. Pilihan itu terdiri dari normalize, HDR, selective, dan average. Bagi anda yang penasaran dengan mode-mode pada Bulb Mode silahkan anda mencobanya pada Snail Camera anda, dengan terus mencoba maka anda akan mendapat sebuah hasil yang sangat spektakuler dan tentunya ilmu dan wawasan yang baru, sehingga tidak terikat pada sebuah artikel saja. Bagaimana menggati dari normalize ke pilihan Bulb Mode lainnya? Anda hanya perlu menekan gambar statistik yang ada diatas tulisan normalize, maka anda akan berpindah ke pilihan selanjutnya yaitu HDR, jika anda menekan lagi maka akan menuju ke pengambilan gambar secara selective, dan jika anda menekan lagi maka akan menuju ke average, dan kembali lagi ke normalize jika anda menekannya lagi.
Jadi susunannya adalah
Normalize > HDR > Selevtive > Average > (kembali lagi ke awal)
Selanjutnya kembali ke Bulb Mode, terdapat pilihan pengaturan warna pada gambar seperti pada Enhanced Mode, dan tentunya saya pikir sudah tidak perlu dijelaskan lagi kepada anda.

Kamera setting Snail Camera – Untuk membuka kamera setting anda hanya perlu menekan pilihan yang ada di kanan atas kamera, lebih tepatnya di sebelah kiri dalam memilih mode kamera ( < ).


Apa yang ada dalam pilihan pengaturan kamera? Berikut ulasannya.
Pada pilihan pengaturan terdapat menu Parameters, Tools, Display, Swap, dan More.
1.      
      Parameters


Pada pilihan parameters, terdapat pilihan Flash, White Balance, Exposition, Focus, Scenes, dan Effects.
Pada pilihan Flash terdapat pilihan pengaturan lampu Flash anda, dalam mode Off, Auto, On, Red Eye, Torch. Yang mempunyai fungsi yang berbeda-beda.

White Balance


Lalu pada White Balance, anda dapat mengatur mode kamera, dalamnya terdapat pilihan Auto, Daylight, Cloudy, Twilight, Incadescen, Fluorscent. Maksudnya mode ini adalah tipe cahaya yang akan berpengaruh pada gambar.


Selanjutnya Exposition, berguna untuk kecerahan gambar anda dapat menaikkan sampai +3.0ev dan menurunkannya sampai -3.0ev.

Focus


Focus, ini merupakan pemfocusan camera. Terdapat tiga pilihan Focus yaitu Auto, Macro, dan Infinity.
Focus auto atau bisa disebut auto focus merupakan mode dimana kamera dapat memfocuskan pandangan kepada objek terdekat sesuai dengan kemampuan kameranya.
Macro focus adalah tipe focus yang digunakan untuk memotret foto macro, dengan cara anda menentukan titik focus objek yang hendak anda ambil.
Infinity focus adalah focus tak terbatas, biasanya focus ini digunakan untuk mengambil sebuah foto pemandangan.

Scenes


Kita masuk dalam Scenes, scenes ini adalah sebuah pengaturan bagi anda untuk memotret sebuah gambar sesuai dengan situasinya, dan tentunya scenes ini sudah diatur secara tepat bagaimana ISO dan beberapa pengaturan lainnya yang cocok pada smartphone anda dalam keadaan yang tercantum.
Dalam Scenes terdapat, auto, portrait, landscape, night, night portrait, steady, beach, snow, sunset, fireworks, sport, party, candle, dan theatre. Tentunya itu mempunyai setinggan yang berbeda-beda, contohnya fireworks mempunyai pengaturan ISO yang berbeda dengan landscape.

Effects


Dalam effects terdapat pilihan warna gambar yaitu normal, mono, sepia, aqua, negative, blackboard, whiteboard. Dan tentunya warna gambar yang dihasilkan foto tersebut sangatlah unik.

Tools


Pada pilihan tools terdapat 3 pilihan yaitu Timer, Noise Reduction Off (bisa menjadi On bila kita memilih pilihan selanjutnya yaitu Noise Acquistion), serta yang telah dikatakan sebelumnya yaitu Noise Acquistion.
Timer merupakan hitungan mundur setelah kita menekan tombol shutter dan ketika hitungan mundur itu habis maka kamera langsung mengambil gambar.
Noise Reduction Off/On fungsi ini akan bekerja ketika kita memilih pilihan selanjutnya yaitu Noise Acquistion. Fungsi dari kedua pilihan ini berbicara tentang noise yang dihasilkan kamera ketika mengambil foto, maka oleh sebab itu pilihan ini digunakan untuk menurunkan noise sebuah pada kamera ketika mengambil gambar dengan menggunakan sensor dari kamera sehingga kamera secara otomatis menurunkan noisenya. Kembali lagi ke Noise Reduction Off/On, maksudnya adalah pilihan “Ya” atau “Tidak” jika ingin menurunkan noise. Pada gambar diatas merupakan setingan bahwa noise tidak diturunkan.

Display Setting

Display Setting adalah pengaturan dalam mengambil gambar. Terdapat pilihan Histogram On/Off, Grid Golden, dan Level Off.
Histogram jika dinyalakan (on) maka anda akan melihatnya di sebelah kiri dengan sebuah kotak yang akan menujukkan statistic warna.
Grid Golden, adalah tampilan garis-garis yang menunjukkan sebuah bidang kotak, bisa digunakan untuk mengambil gambar agar terlihat rata.
Level jika dinyalakan (on) maka akan menampilkan kerataan kamera dengan tampilan seperti saat zoom menggunakan sniper di game counter strike.

Swap
Pilihan ini merupakan pilihan untuk menggunakan kamera depan atau belakang (mengganti kamera). 

More


Dalam pilihan ini semua menu yang ditampilkan seperti diatas akan diubah menjadi seperti dibawah ini dengan tujuan agar pengguna mengerti.

Bagaimana cara melihat gambar yang telah diambil dengan aplikasi ini?
Cukup dengan memilih gambar yang berarti galeri yang ada di bagian kanan bawah kamera.


Anda telah membaca artikel tentang SNAIL KAMERA, jika anda ingin copy artikel ini mohon menuliskan link ini atau blog ini sebagai sumber artikel.
- Hallo sahabat The secret, Pada Artikel yang anda baca kali ini dengan judul , kami telah mempersiapkan artikel ini dengan baik untuk anda baca dan ambil informasi didalamnya. mudah-mudahan isi postingan Artikel photoblog, Artikel smartphone, Artikel snail camera, yang kami tulis ini dapat anda pahami. baiklah, selamat membaca.

Judul : Review Snail Camera
link : Review Snail Camera

Baca juga


REVIEW SNAIL CAMERA


Snail Camera merupakan sebuah aplikasi kamera yang dibuat untuk android. Snail Camera terdiri dari dua macam yaitu Snail Camera versi gratis, dan Snail Camera Pro yang berbayar. Kali ini kita akan membahas tentang aplikasi ini.
Snail Camera mempunyai sebuah tampilan yang dibilang cukup simple, dengan semua bentuk pilihan entah itu menu dan tombol mengambil gambar ada disebelah kanan.


Dan yang ada di atas merupakan tampilan dari Snail Camera. Yang ditampilkan diatas merupakan tampilan dari Snail Camera Pro, dengan kamera yang sengaja ditutup.
Dalam Snail Camera terdapat beberapa pilihan mode pengambilan gambar antara lain sebagai berikut:
1.       Normal Mode
2.       Enhanced Mode
3.       Multi Mode
4.       Bulb Mode


      Normal Mode

Normal Mode merupakan mode pengambilan gambar seperti biasa saja, bisa ditambahkan dengan beberapa efek ataupun pengaturan yang lain (Untuk bagian efek ataupun pengaturan lain berada dibawah). Dan Normal Mode merupakan mode awal dimana ketika kita membuka aplikasi Snail Camera.

   Enhanced Mode

Enhanced Mode, tentunya anda bertanya apa fungsi dari Enhanced Mode? Jika dilihat dengan sekilas Enhanced Mode terlihat sama seperti Normal Mode. Namun, jika diperhatikan dengan seksama dibawah pilihan shutter ada pengaturan warna, nah hal ini yang merupakan kegunaan dari Enhanced Mode.
Catatan: Pengaturan warna yang dimaksud adalah lingkaran yang ada di sebelah kiri kotak yang berwarna hijau. Dan kotak hijau tersebut adalah kotak perintah jika diaktifkan maka kotak itu berwarna hijau. Perintah tersebut meliputi pengaturan warna yang kita atur dari dari lingkaran yang ada di sebelah kotak tersebut.


Pada gambar diatas terdapat tiga pilihan yang bisa dinaikkan atau diturunkan (Ke kanan dan ke kiri). Pilihan pertama yaitu sebagai pengatur kecerahan warna, pilihan kedua yaitu pewarnaan hitam dan putih atau disebut BW, pilihan ketiga adalah satruasi warna.
Multi Mode


Multi Mode merupakan suatu pilihan dimana kita dapat mengambil sebuah foto dengan beberapa kali dengan background yang sama ataupun berbeda dan diolah menjadi satu foto.
Dari gambar diatas dapat kita lihat dibawah tombol shutter terdapat gambar dan gambar itu merupakan suatu pilihan “selesai, silahkan olah” yang akan kita tekan ketika sudah selesai mengambil foto. Dibawahnya gambar tersebut terdapat tulisan “0exp” itu berarti menunjukkan jumlah frame yang telah anda ambil untuk dijadikan satu foto. Jika anda telah mengambil foto sebanyak 2 kali maka tulisan tersebut akan berubah menjadi “2exp”.
Selanjutnya terdapat kotak hijau yang berarti “Ya” atau “tidak”. Sebelum membahas kotak hijau tersebut, saya akan menjelaskan tentang gambar mata yang anda lihat disebelah kotak tersebut. Gambar mata tersebut mengartikan “tampilkan frame jika anda telah memotret satu kali dan ingin melihat hasil sementara jika anda ingin meemotret sekali lagi sampai anda akhirnya selesai”. Dari penjelasan gambar mata tersebut tentunya anda mengerti apa maksud dari kotak hijau tersebut. Silahkan anda coba pada aplikasi Snail Camera anda.

 Bulb Mode


Bulb Mode, merupakan suatu mode pembukaan lensa kamera sehingga membuat kamera dapat menangkap cahaya ataupun apapun yang bergegak sehingga meninggalkan jejak. Mode ini sama seperti mode Slow pada kamera DSLR ataupun pada aplikasi Camera FV-5.
Untuk lebih mengetahui, Bulb Mode terdapat berbagai macam pilihan yang dapat kita lihat pada gambar yang ada dibawah tombol shutter. Pilihan itu terdiri dari normalize, HDR, selective, dan average. Bagi anda yang penasaran dengan mode-mode pada Bulb Mode silahkan anda mencobanya pada Snail Camera anda, dengan terus mencoba maka anda akan mendapat sebuah hasil yang sangat spektakuler dan tentunya ilmu dan wawasan yang baru, sehingga tidak terikat pada sebuah artikel saja. Bagaimana menggati dari normalize ke pilihan Bulb Mode lainnya? Anda hanya perlu menekan gambar statistik yang ada diatas tulisan normalize, maka anda akan berpindah ke pilihan selanjutnya yaitu HDR, jika anda menekan lagi maka akan menuju ke pengambilan gambar secara selective, dan jika anda menekan lagi maka akan menuju ke average, dan kembali lagi ke normalize jika anda menekannya lagi.
Jadi susunannya adalah
Normalize > HDR > Selevtive > Average > (kembali lagi ke awal)
Selanjutnya kembali ke Bulb Mode, terdapat pilihan pengaturan warna pada gambar seperti pada Enhanced Mode, dan tentunya saya pikir sudah tidak perlu dijelaskan lagi kepada anda.

Kamera setting Snail Camera – Untuk membuka kamera setting anda hanya perlu menekan pilihan yang ada di kanan atas kamera, lebih tepatnya di sebelah kiri dalam memilih mode kamera ( < ).


Apa yang ada dalam pilihan pengaturan kamera? Berikut ulasannya.
Pada pilihan pengaturan terdapat menu Parameters, Tools, Display, Swap, dan More.
1.      
      Parameters


Pada pilihan parameters, terdapat pilihan Flash, White Balance, Exposition, Focus, Scenes, dan Effects.
Pada pilihan Flash terdapat pilihan pengaturan lampu Flash anda, dalam mode Off, Auto, On, Red Eye, Torch. Yang mempunyai fungsi yang berbeda-beda.

White Balance


Lalu pada White Balance, anda dapat mengatur mode kamera, dalamnya terdapat pilihan Auto, Daylight, Cloudy, Twilight, Incadescen, Fluorscent. Maksudnya mode ini adalah tipe cahaya yang akan berpengaruh pada gambar.


Selanjutnya Exposition, berguna untuk kecerahan gambar anda dapat menaikkan sampai +3.0ev dan menurunkannya sampai -3.0ev.

Focus


Focus, ini merupakan pemfocusan camera. Terdapat tiga pilihan Focus yaitu Auto, Macro, dan Infinity.
Focus auto atau bisa disebut auto focus merupakan mode dimana kamera dapat memfocuskan pandangan kepada objek terdekat sesuai dengan kemampuan kameranya.
Macro focus adalah tipe focus yang digunakan untuk memotret foto macro, dengan cara anda menentukan titik focus objek yang hendak anda ambil.
Infinity focus adalah focus tak terbatas, biasanya focus ini digunakan untuk mengambil sebuah foto pemandangan.
Scenes


Kita masuk dalam Scenes, scenes ini adalah sebuah pengaturan bagi anda untuk memotret sebuah gambar sesuai dengan situasinya, dan tentunya scenes ini sudah diatur secara tepat bagaimana ISO dan beberapa pengaturan lainnya yang cocok pada smartphone anda dalam keadaan yang tercantum.
Dalam Scenes terdapat, auto, portrait, landscape, night, night portrait, steady, beach, snow, sunset, fireworks, sport, party, candle, dan theatre. Tentunya itu mempunyai setinggan yang berbeda-beda, contohnya fireworks mempunyai pengaturan ISO yang berbeda dengan landscape.

Effects


Dalam effects terdapat pilihan warna gambar yaitu normal, mono, sepia, aqua, negative, blackboard, whiteboard. Dan tentunya warna gambar yang dihasilkan foto tersebut sangatlah unik.

Tools


Pada pilihan tools terdapat 3 pilihan yaitu Timer, Noise Reduction Off (bisa menjadi On bila kita memilih pilihan selanjutnya yaitu Noise Acquistion), serta yang telah dikatakan sebelumnya yaitu Noise Acquistion.
Timer merupakan hitungan mundur setelah kita menekan tombol shutter dan ketika hitungan mundur itu habis maka kamera langsung mengambil gambar.
Noise Reduction Off/On fungsi ini akan bekerja ketika kita memilih pilihan selanjutnya yaitu Noise Acquistion. Fungsi dari kedua pilihan ini berbicara tentang noise yang dihasilkan kamera ketika mengambil foto, maka oleh sebab itu pilihan ini digunakan untuk menurunkan noise sebuah pada kamera ketika mengambil gambar dengan menggunakan sensor dari kamera sehingga kamera secara otomatis menurunkan noisenya. Kembali lagi ke Noise Reduction Off/On, maksudnya adalah pilihan “Ya” atau “Tidak” jika ingin menurunkan noise. Pada gambar diatas merupakan setingan bahwa noise tidak diturunkan.

Display Setting

Display Setting adalah pengaturan dalam mengambil gambar. Terdapat pilihan Histogram On/Off, Grid Golden, dan Level Off.
Histogram jika dinyalakan (on) maka anda akan melihatnya di sebelah kiri dengan sebuah kotak yang akan menujukkan statistic warna.
Grid Golden, adalah tampilan garis-garis yang menunjukkan sebuah bidang kotak, bisa digunakan untuk mengambil gambar agar terlihat rata.
Level jika dinyalakan (on) maka akan menampilkan kerataan kamera dengan tampilan seperti saat zoom menggunakan sniper di game counter strike.

Swap
Pilihan ini merupakan pilihan untuk menggunakan kamera depan atau belakang (mengganti kamera). 

More


Dalam pilihan ini semua menu yang ditampilkan seperti diatas akan diubah menjadi seperti dibawah ini dengan tujuan agar pengguna mengerti.

Bagaimana cara melihat gambar yang telah diambil dengan aplikasi ini?
Cukup dengan memilih gambar yang berarti galeri yang ada di bagian kanan bawah kamera.


Anda telah membaca artikel tentang SNAIL KAMERA, jika anda ingin copy artikel ini mohon menuliskan link ini atau blog ini sebagai sumber artikel.